
Meet Jamie Beason. She is a Senior Director of Business Intelligence and Analytics at JLL, a global professional services company specializing in real estate and investment management. Jamie has built an analytics team with a thoroughness and thoughtfulness that I’ve rarely seen.
If you are in the position of creating your own analytics team—or even if you are an analytics team of one—her approach is a blueprint worth emulating.

Jamie is also modest. What she’s done in her role at JLL is impressive and I wanted to help share some lessons from her analytics team-building approach. Jamie’s Data Fluency team, a subset of her larger Business Intelligence team, is focused on facilitating the use of data throughout the organization. Here’s how she describes the objectives:
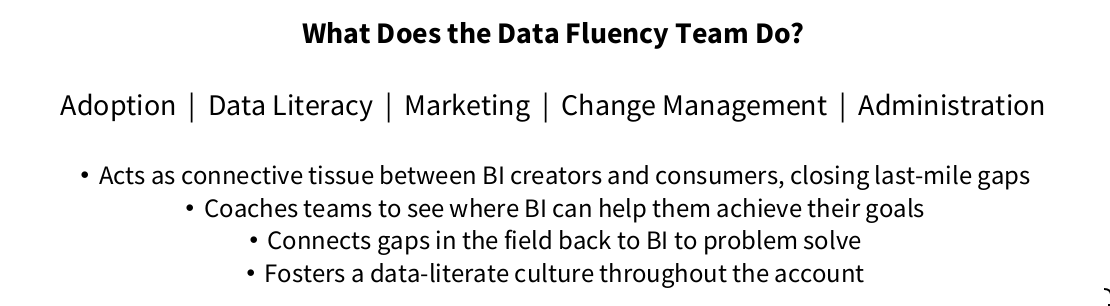
At the core of this team is a focus on the “last mile” challenges of analytics—bridging the gap between the data and the decision-makers. The Last Mile of Data is less about technology and more about people-to-people communication. Her team starts with this people-first perspective rather than the all-too-common fixation on the technical issues and tools of analytics. In learning about what she’s done, I bucketed her activities into six key lessons:
Build a team that understands the business as much as the data and tools;
Educate your customers;
Push solutions rather than wait for people to come to you;
Even great data products need to be sold;
Actively curate the portfolio of data products;
Always be proving your value.
Build a team that understands the business as much as the data and tools
A lack of a common language and understanding results in disconnects between data analysts and business decision-makers. Jamie prioritizes filling this knowledge gap:
In my experience, the real magic happens when someone who understands the business unites with someone who understands data and analytics. Most of my team, myself included, are new to this industry, and until we understand the business, we’ll only ever be ticket-takers who build whichever dashboards or automations we’re asked to. My goal is to up-skill BI professionals with the business-specific basics, at a minimum, so that we can connect dots our customers would have never thought to ask for.
Educate your customers
Jamie and team recognize that their analysis will only make an impact if the recipients of information have data skills themselves. To that end, the analytics team proactively delivers learning tools so business customers can become more data fluent.
Library of Data Moments for brief drips of data education: Similar to the popular Safety Minutes/Moments we see as the common start to meetings, these micro-trainings are designed to weave organically into any meeting. Our intent here is find those that need Data Fluency/Literacy training and awareness where they’re at. We know we can’t wait for them to come to us.
Data Fluency training program: This will be similar to other L&D content employees take at their company like leadership or presentation skills training. We have our modules defined and are nearly ready to release our first one. It is interactive and intentionally designed to inform participants first of the importance of being data savvy, not just at work but everywhere!
Customer-facing BI guidebook: This is meant to address the repeat questions we often receive from customers about how to best engage with our team. It’s a laymen’s term quick guide that walks users through how to request access, ask for support, submit a request for a new report, etc. This has been a hit!
Push solutions rather than wait for people to come to you
Over and over, I hear from frustrated analytics professionals who create valuable data products, but can’t get their audiences to engage. One answer: bring it to them in the channels and times when they are willing to give attention. Jamie’s Data Fluency team has searched for opportunities to inject data into existing communication channels and connect with their business users.
Data Trivia in Newsletters (with prizes!): Who says you can’t have fun at work? Not us! In another effort to meet the customer where they’re at, we’ve partnered with our communications team to create a new section in their monthly newsletter. We pose a data question and hold a random drawing for everyone that submitted the correct answer, and the winner gets $25 to our corporate store!
Data Tips of the Week for Service Line newsletters & Client Portal tile: We added a new section to the portal we use at work that highlights a quick data tip. This is another effort to get front and center of where our customers live and breathe. If they see us (Data/BI) everywhere, our customers can only ignore us for so long!
Even the best data products need to be sold
Despite the best intentions to bring data into decision-making, business users are busy and distracted. Therefore, it is important to take extra steps to teach your users how to use these products and show why they should be excited about the impact. I particularly like Jamie’s focus on telling stories about “wins” because this is one of the quickest ways to encourage adoption.
BI User Stories: What better way to bring new customers into the BI fold than have them hear from a colleague the wonders it’s done for them? Sharing a few first-person sentences about how BI is saving the day tackles a few things: the message increases awareness, makes it more approachable (because it’s coming from people they know with less bias than if it came from the BI team), and it helps prove our ROI because some of these include call-outs to metrics that have improved.
Training Videos (big hitter: BI Portal Overview): The BI content (reports and dashboards) that we create lives on this BI Portal, so it’s imperative that people know how to navigate it. The purpose of creating this video is to make it quick and painless for people to both learn how to navigate but also what all is available for them. Since spinning up our Data Fluency team, we have found pockets within our customer base that don’t know a thing about BI or what we do. So, we start them at the beginning by acquainting them with what already exists.
BI updates on all regional client-facing QBR’s and internal townhalls: One of the aims our Data Fluency team is to simply be more visible and cross more desks. One way we do this is by volunteering to present on large calls such as our Quarterly Business Reviews or internal townhalls, which so far has been eagerly accepted. Again, if we come to the customer, they can’t help but see us!
Hosting dashboard walkthroughs: While we deliver training anytime we create a new BI product, we find that with turnover, the memory of that tool can atrophy. Hosting dashboard walkthroughs is our effort to remind people what’s out there today that they could leverage to improve their ability to make data-informed decisions.
BI Office Hours (added recently): These are similar to the dashboard walkthroughs, but the agenda can range a bit more. In this bi-weekly call, we send an agenda in advance based either on feedback we know people want to learn about or that we think is relevant. BI Leadership is also on the line to field any questions from the wide customer base. This started small but the audience is growing.
Actively curate the portfolio of data products
Many organizations end up with more dashboards and reports than they know what to do with. And the pile of data products only seems to grow. Jamie has found ways to make the JLL data products easily searchable while also trimming those that don’t add value. Here are three approaches her team put in place:
Customer-Facing BI Usage Dashboard with Recommendation Engine: This is designed for two main purposes. One is to give people, mainly managers, visibility into who’s using what (or isn’t). The other is to help people onboard more effectively. They can filter by their service line and see the most-used reports and dashboards. The viz will also recommend dashboards they should consider using (“People that use dashboard A also use B, C, and D the most”).
BI Catalog to help customers locate the data, report, or dashboard they need: Our purpose here was to make searching for items easy. Our catalog is in excel which makes CTRL+F easy to locate key words. Users can also filter for their service line and see a list of what’s available. It also includes key details such as refresh timing, owner, key stakeholder, etc. Given the size of our scope and the customer base we support, everything our team does needs to work at scale, and this catalog helps us do that.
Archiving process for BI products and reports: True to Lean methodologies, we often ask “does this add value” and if it doesn’t, we find a way to remove it. Our archiving process tackles two things: It reduced the technical debt by requiring fewer items be supported, and it leans out our offerings, thus reducing confusion amongst our customers. If there are too many choices, we risk them just walking away, so we want to keep their list of relevant reports as lean as we can.
Always be proving your value
Analytics and data teams can struggle to show the return on investment for their activities. In particular, it is hard to measure the value of the many informed decisions that you might be impacting. Don’t wait for senior leadership to start asking these challenging ROI questions. Jamie and team have proactively developed analyses and reports that explain their impact while also reaching out to stakeholders for feedback so they can continue to improve.
QBR Decks for Global BI Leadership: These are requested and not something we volunteered to make but in hindsight we should have! These decks give us a chance each quarter to highlight all of the wins across the team in front of leadership. They’re also superb for referencing later and adding up as the year progresses.
ROI Dashboard capturing BI’s value varietals: I will admit we are still trying to crack this nut but we are well on our way. Quantifying the full ROI of a BI team is a challenge because not everything we do is a simple cost-out or efficiency effort. That said, we capture a variety of different metrics each quarter aimed at telling our full story and articulating our full value.
Quarterly BI CSAT Surveys: This was one of the first things we did when standing up the DF team. Leading by example, we wanted our actions to also be data-informed and we didn’t have any data…so we collected it ourselves. I have used the results from these surveys in a variety of leadership capacities to illustrate, with data, how many customers consider BI dashboards and reports as a critical part of how their team gets work done and equally as important, how they see their need for BI changing in the next 6 months.
If you are in an analytics leadership role, I encourage you to connect with Jamie Beason on LinkedIn to learn more.