
Reading Larry Burns’ “Data Model Storytelling” (TechnicsPub.com, 2021) was a really good experience for a guy like me (i.e., someone who thinks that data models are narratives). I agree with Larry on so many things. However, this post is not a review of Larry’s book. Read it for yourself – highly recommended.
Reading it triggered me into some deep thoughts (I think) about the nature of Data Modeling. It is easy to get philosophical about it:
“The world is everything that is the case.”
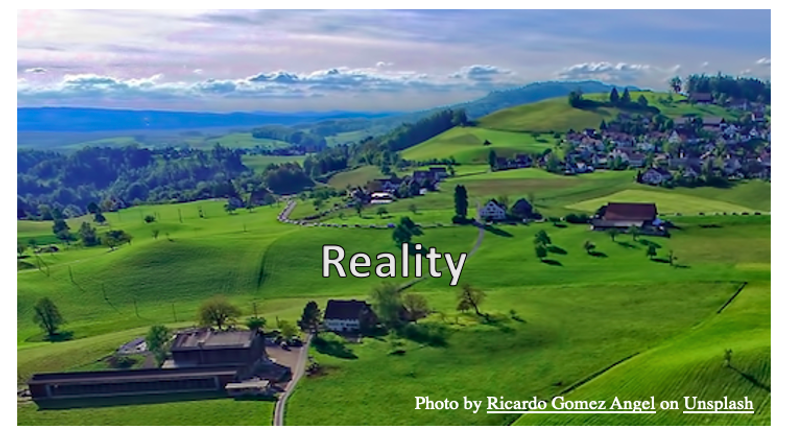
The data model certainly is not the data but a representation of it. And data are not real in themselves: The title above this section is from the German philosopher Ludwig Wittgenstein in 1922. The real world is what is, and data about that is a way to tell the story about what is. And telling that story – that we must!
Reality: The real world itself (“Thing in itself” / “Das Ding an sich,” Emmanuel Kant, 1781) – is a realm that philosophers, scientists, knowledge engineers, real engineers, and information scientists are battling and struggling to try to get to grips with.
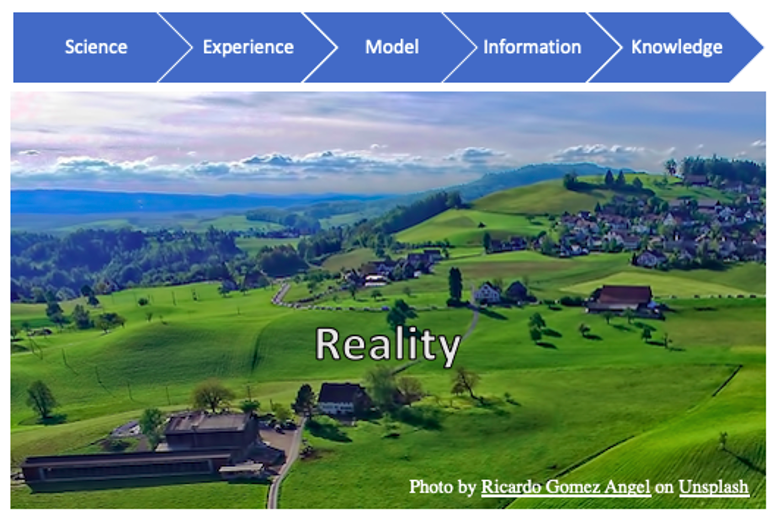
Storytelling about the world, then, can take place within five layers of context:
1. Science: Scientists formulate theories and prove them, developing abstract formalisms as they go.
2. People: Experience the real world using the perceptual and cognitive capabilities that evolution has provided to us (aka intelligence). Business people pass on explicit and implicit knowledge to data modelers.
3. Data modelers (including knowledge modelers): Create representations of concepts and their semantics, communicating those narratives that describe the structure and meaning of reality as experienced by scientists and domain experts, thus creating frameworks for handling and persisting data. Such data models are passed on to the information consumers.
4. Information: Collections of actual data conforming to one or more data models, representing parts of reality. Today this is a mix of database contents and other kinds of contents such as JSON or documents. Semantic data models are prerequisites for:
5. Knowledge: Processed information over time, by people or algorithms, is the basis for collecting real knowledge about reality – these days frequently persisted as knowledge graphs.
Let us dig down one level to some important points in this value chain.
Digging for the Ultimate Truth
As we already know, describing the world as it is, is kind of difficult – not least because there still are many unknowns. However, for us to navigate, we do not need all details. Do not try to calculate gravitational acceleration while falling down from the top floor … Even today, many of the “precise” models of reality are pretty abstract. (If in doubt about this, read a couple of academic papers on quantum information models.)
However, people have been, and are, trying to get some relatively precise, documented understandings of, say, a knowledge/business domain; with activities such as:
- Knowledge elicitation (using concepts maps or topic maps etc.),
- Semantic modeling of ontologies and taxonomies (using RDF and OWL),
- Semantic databases representing ontologies etc. (there are at least 40+ vendors in the area)
That looks like data modeling and data representation, and it is despite some methodological and functional differences. Knowledge elicitation and knowledge management are nothing new – about the same as data modeling, I would say. But the two communities of practice have not interacted much.
That is changing. Is there anybody who is not interested in knowledge graphs these days?
Let us see what we, the folks in “automated data processing,” did to get where we are today.
Storytelling by the Data Modeling Guild
The Data Modeling communities of practice have been developing their frameworks and abstraction sets since around the 1960s. We were at square one and had to invent and pave our way forward.
And we have indeed been advocating practices as being so right and truly universally applicable, only later to discover that they were not (OO to give an example).
That is why Larry’s book is so refreshing. Focus on communicating a profound and helpful story – do not force yourself too much to comply with this or that methodological perspective – assure that you tell the true story about the meaning of the data that (business) people have to live happily with.
We have made some very basic mistakes as we developed these practices. Most unfortunate were:
- Mistaking representation for being the real thing (content)
- Believing that every new project is something new, even if it is only the representation that will change
- Used too little time on business-/domain-oriented concepts and their relationships
- Misusing abstract constructs out of their intended contexts
Content or Representation?
A lot of work is being performed because of the perceptual error that a new representation represents something new. Not so, the business of renting out hotel rooms has some pretty well-understood concepts and relationships, for example. Yes, many times we have started the good old “coast to coast” Data Modeling railroad train (going uphill most of the time), because “this is “something new.” Not so, YAML might have been new as a style of representation, but most of the content in those files is old wine. We will come back to this.
Where Are the Data?
Before automated data processing (i.e., before around 1890) state of the art was documents, ledgers, censuses, and forms. A form is not a data model, but there are some structural patterns, right?
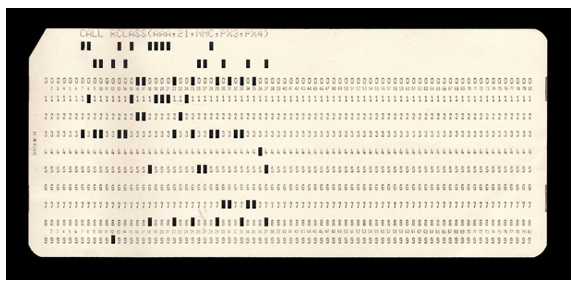
Automated data processing (ADP) began around 1890 with Hollerith’s invention of the punched cards for the census bureau.
Punch cards are not data models, but the structure of the records (and sub record types) in a box of punched cards for a given domain does have some structure and meaning. So, they did not invent a new data model for ledgers (f.x.), but they developed a representation that could fit it into punched card files.
One major challenge was automating what in manufacturing is called bills of materials.
A many-to-many relationship between items and parts over possibly many levels. Here the available representation schemes (sequential, non-electronic files on paper or punched cards) did not suffice as solutions to a very real business problem. The hierarchical structures do not completely describe the real data model, which involves relationships, like “consists of” and “where used”:
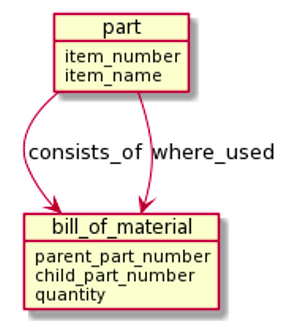
The individual BOM is a hierarchy of parts having subparts. But some basic component parts (like nuts and bolts) may be used in many end product assemblies. M:M structures are found in many domains, as we all know today. If you see things visually, what you see, when you look at combinations of M:M relationships, is a graph. Graphs have been in mathematics since the 18th century (invented by Leonhard Euler for the Prussian king). But building graphs on early computers was an in-memory thing with strong limitations because of limited memory sizes (a few MB, if you were really lucky).
Hardware to the Rescue
Here is what started the ADP revolution: the advent of the magnetic tape file storage. The data were represented as hierarchies of specific record types sharing multiple levels of (unnamed) parent-child relationships. You could do that with punched cards as well, but having three or more tape drives on your computer enabled to do sort/merge operations; reading two (or more) files and writing a new result file on the way.
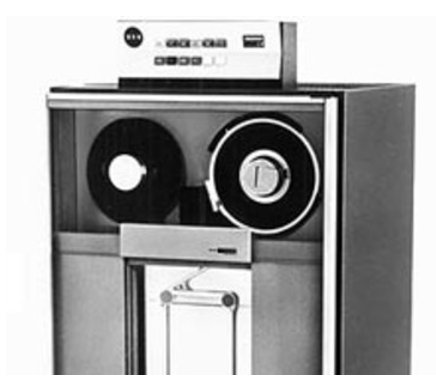
Before that, your abilities to compare and merge were limited by your computer memory size, doing algorithms such as binary search or multi-pass algorithms.
Sorting and searching are so important and in my mind form the bedrock of database technology. And that understanding came to be realized in the late ’60s and early ’70s – so much so that computer pioneer Donald Knuth (at Stanford) in 1974 published the pioneering book “Sorting and Searching,” which over 722 pages described everything you needed to know, to solve these algorithmic challenges. It was volume three of his “The Art of Computer Programming” series. I still have my copy – it helped me decide to become a database person.
So, even applying tape drives did not change the data model, it (again) refactored a representation of the underlying domain model, (BOM, f.x.).
Until now, Data Modeling/representation design was done by programmers.
Going DASD!
And then all broke loose with the introduction of the rotating disk drive (around 1955):
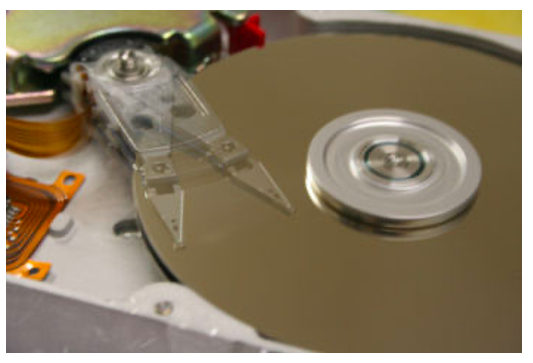
Structured data was now a reality, because of DASD (direct access storage devices). Direct access means getting straight to your target (by way of pointers or indexes). Sorting was handed over to the database (using indexes or sorted sets of records). Searching was, likewise, handed over to the data (using indexes and possibly also data scans).
There were a few early database products:
- Direct access solutions like
- IBM’s BOMP (yes, BOM processing) and DBOMP
- Cincom’s TOTAL (1068) was also important (and pointer based)
- GE / Honeywell / Cullinane’s IDS / IDMS (designed by Charles Bachman in the ’60s), a hashing-and-pointer-based DBMS network database with indexing
- IBM’s DLI (Data Language/I) and later IMS (Information Management System)
- Hierarchical solutions like
- ISAM (indexed sequential access method),
- VSAM (Virtual Storage Access Method, a “multiple” ISAM solution)
Each of them had their proprietary languages, often implemented as preprocessors generating calls in COBOL, FORTRAN, etc.
The network databases handled M:M without problems, whereas IBM invented something called “logical children”:
- In DLI and IMS the representation was a set of hierarchical structures accessed by hashing onto the top level of each,
- Crossing over from one hierarchy to another (in order to implement M:M) was enabled by defining a logical child (from a parent level in one hierarchy to a child level in another).
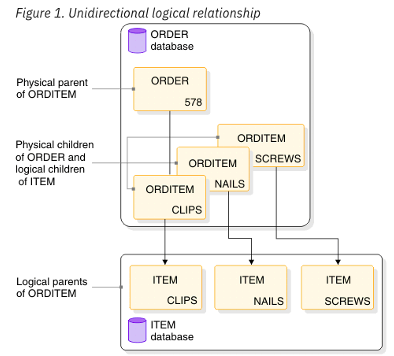
Logical child was a not a perfect term for what was in fact a relationship (represented as a pointer). Why not just call it that? Maybe because the relationship was unidirectional, and a general relationship can be directional?
Anyway, getting direct access opened ways of representing data that effectively supported implementing M:M relationships in databases.
Enter the Data Modelers
At this time the data modelers knocked on the door and came in. CODASYL Conference on Data System Languages (building on IDS/IDMS, 1969) contained a data modeling paradigm, which looks like a property graph. And in 1976 Peter Chen published his Entity-Attribute-Relationship model, which also looks like a property graph.
By the early ’80s that was what the market looked like – IBM, Cullinane, and Cincom dominating the large corporations and E-R modeling helped the Data Modeling trade growing into a professional “guild.”
So, the ’70s brought real new stuff (direct access and support for relationships). But, still, a lot of the projects were busy refactoring sequential, hierarchical solutions into disk-based solutions – most frequently carrying over the structural designs previously designed as hierarchies using sub record types.
Tables and M:M
At this point you might ask: Didn’t you forget to mention relational models? No, but my perspective on these matters (in a 1980s context) is that the relational surge happened mostly on the DBMS level, not so much on the Data Modeling level.
Tables as a data model was not really something new (coming from Records in databases and Entities in Chen modeling). And relationships (in the general sense) did not exist in the relational model. The relational model had “joinable relations,” but in fact a relation is the record, not a reference. So, the context of a relationship was not there. In SQL, a JOIN construct was part of ANSI SQL 1986, and in 1989 foreign keys were added into the SQL standard. But foreign keys (which is what survived) is just a constraint, not a structural component making query resolution in SQL a complex logic behind the scenes.
To me it seems that the relational model started on the premise of having a bunch of fields (called a first normal form relation). The process of normalization then, by way of “functional” dependencies of attributes to their keys, created an acceptable data structure. This exercise seems to inherit from the data representational refactoring exercises of the ’70s the assumption that “here we have some fields” – coming from a form or a tape file – what can we do about them?
So, since then, a lot of effort has been spent on normalizing to fifth or sixth normal form, including data vaults – only to making another representational shift, this time to NoSQL.
And in many ways, NoSQL (not the graph versions of that) resembles physical structures coming straight out of the ’70s. Based on massive amounts of (cheap) hardware, wonders could be created by employing simple data representation schemes (hierarchical, mostly).
However, there is another timeline, which goes from network databases (like IDMS) and Peter Chen’s modeling practices to the property graph databases, which are very popular today, precisely because of their focus on relationships and their semantics.
Other Noteworthy Misconceptions
Just a few notes on some additional mistakes, which have been confusing, when what you have to do is to produce helpful and truthful narratives about representations of data:
Concepts or Conceptual
I have never understood why a top-level overview diagram is called a “conceptual model.” Why conceptual? Was the model done in a specific conceptual way? (Boxes and arrows, maybe?). If not, how come that the things in the diagram are “conceptual”? But they are not. Why not simply an “overview of the most important business concepts”? That would help to explain the flow from overview to implementation.

Is this a conceptual model of the world? It does give an overview, and it is a high-level generalization…
Canonical Data Models
Domain-Driven Design became popular around 15 years ago as a cost-effective and agile alternative to Data Modeling. But, the fact that many domains exist creates a need to bridge them by an encompassing “canonical data model.” Is the collection of canonical data models in an organization an “enterprise data model,” which would be canonical in the true sense? Certainly not.
Most people today agree that the “enterprise data model” is not achievable and that healthy Data Governance does not require one such.
J(a)son and the Golden Fleece
Many ways of moving data today involve generating JSON structures for transport. And many a developer believes that the data representation in the JSON file is identical to the real data model. Not so. M:M is a challenge, frequently ill-handled. Reminds me of IBM’s Logical Children of the ’70s…
So, even though J(a)son got the golden fleece, he ended up in really bad company, Medea. Bad as she was, she was supported by the sun god Helios – probably a tech ruler of those days?
Storytelling Is the Heart of the Matter
Dealing intelligently with reality is one thing. Complex, yes:
Unfortunately, It has been difficult for the IT communities to keep Data Modeling issues independent of DBMS technology discussions. But we will get that sorted out, soon.
Larry Burn’s book on Data Model Storytelling is a great help. I have picked a few of his chapter titles, which I find particularly helpful:
- Agile Data Modeling
- Modeling Up and Building Down
- In Search of Meaning
- Data Modeling and Design
And yes, then there are graphs. Databases are representations modeled for communicating the structure and meaning of a particular set of data. Graphs are naturally born for semantic networks. SQL missed forceful declarations of relationships – the heart of semantics. So, graph is both a place to start (you can derive the other abstractions like tables and documents from graphs), and graph is also a place to end: Collect and combine your organizations’ core (key) base data and accumulated knowledge in your knowledge graph!