
Click to learn more about author Thomas Frisendal.
This is a summer special, on the lighter side, but addressing a simply overwhelming issue at times.
What Are You Talking About?
Sometimes the obvious is not that … obvious.
Many people know that I am on the graph-y side of the house. But explaining a simple matter like that is not that easy. Because it is not obvious what the obvious is.
It is about what we call things, and it is about overlapping contexts. The realm of the graphs really looks like a map of medieval Europe: small kingdoms and fiefdoms all over the place.
So, we want to talk about graphs. What do graphs consist of? Well, nodes and relationships between nodes with a sprinkle of properties on nodes and relationships, right? Hey, hey – stop a moment! Graphs consist of vertices and edges, claim people, who had university-level mathematics at some point of time. “Graph Theory Proper requires you to call them vertices and edges” is the mantra!
And the forthcoming Graph Query Language, GQL, will have both sets of names at the same time, as synonyms: Nodes = Vertices, Relationships = Edges.
How can people disagree on such simple issues about what to call the basic elements of graphs?
Let us dive into the evolution of the thingies in graph that represent a whereness (nodes and vertices) rather than a betweenness (relationships and edges).
Walking on the edge or maybe over it?
Graph Theory, 1736–1936
The section name above is the title of a book from 1976 (Clarendon Press) by Norman L. Biggs, E. Keith Lloyd and Robin J. Wilson. It is a mathematical history book, recommended to me by a math professor working with graph theory. And I investigated the vocabulary of graph mathematicians over 200 years – all references below are from this book.
A.D. 1736: The very first graph approach was that of mathematician L. Euler in 1736, working on a route-planning problem in the city of Königsberg in Prussia (now Kaliningrad in Russia). The city is by a river, including an island in the river. A total of seven bridges cross the river at various places. The challenge was to find a route where you crossed all seven bridges, but only once. Euler developed a general solution, which is considered the birth of graph theory. But guess what? Euler uses context-appropriate terminology such as route/journey, areas, bridges, and crossings. How very appropriate.
A.D. 1750: L. Euler in a letter to Christian Goldbach describes solids with plane faces depicted as graphs. Here he is using terms such as faces, angles, and edges (!). The focus is clearly geometrical (topological) plane faces.
A.D. 1812: S. A. J. Lhuilier writes about polyhedrometry. Here we find angles, faces, vertices (!), and edges (!); defining facets and faces of polyhedrons. The context is maps on surfaces, which is topology more than graphs.
A.D. 1813: A.-L. Cauchy works on researching polyhedral. Using terms such as sides, vertices, and triangles. Clearly geometry more than graphs.
A.D. 1847: J. B. Listing publishes introductory studies in topology. His context is linear complexes involving aggregates of lines forming surfaces in planes or spherical.
A.D. 1856: T. P. Kirkman discusses the representation of polyedra. The context is polygons and surfaces having edges (!). The same year W. R. Hamilton became famous for much the same thing, but framed as non-commutative algebra. This developed into “The Icosian Game, involving polygons having points and successions (voyages). Today this corner of graph theory is called Hamiltonian circuits – but still a polygonial context.
A.D. 1857: A. Cayley investigating tree structures using branches.
A.D. 1869: C. Jordan on assemblages of lines. Using just that (“lines”) but also vertices (!) (but no edges). The investigation is mostly about mapping to geometrical structures having “continuity” and symmetry.
A.D. 1873: C. Hierholzer investigates the possibility of traversing a line-system without repetition. He talks about nodes, lines, and paths. (Classified as a topology problem.)
A.D. 1879: A. Cayley writing on the coloring of maps. Areas of maps – how many different colors are sufficient for any map? This problem is one of the biggest challenges in graph theory, although the problem is topological, not a graph issue, if you ask me. But there are many “graph” papers in this category.
A.D. 1890: P. J. Heawood takes map coloring to surfaces using terms such as lines and boundaries.
A.D. 1891: L. Heffter writes on neighboring regions. Points, faces, and, yes, edges (!).
A.D. 1891: J. P. C. Petersen defines regular graphs, having vertices and edges. However, the focus was on constructing polygons in a single stroke.
A.D. 1895: G. Tarry investigates “the maze problem.” This involves passages and junctions, working in directions.
A.D. 1922: O. Veblen on linear graphs. Points, cells, matrices, linear graphs, circuits based on vertices, and edges (!). Trees seem to be subsets of such linear graphs. This is based on groundwork by G. R. Kirchhoff and H. Poincaré. The discipline is called algebraic topology.
A.D. 1922: P. Franklin writes on the four-color problem. Yes, the four-color problem was alive and kicking after 43 years. Franklin uses terms such as regions, portions, vertices, edges, and pentagons.
A.D. 1936: D. König publishes “the first graph theory definitional book” (in German): “Theorie der Endlichen und Unendlichen Graphen.” König uses terms such as nodes (points) and edges. The book is available in English (two editions) and you will find it under “topology.”
Apparently many mathematicians saw graphs as a tool in topology.
Pragmatic and Intuitive Perceptions of Semantics
Are we facing a cognitive/perceptive problem here? How come that “edge” became the darling of the academic hearts and brains?
Take a look at these two visuals:
Relationships between language editing at Wikipedia
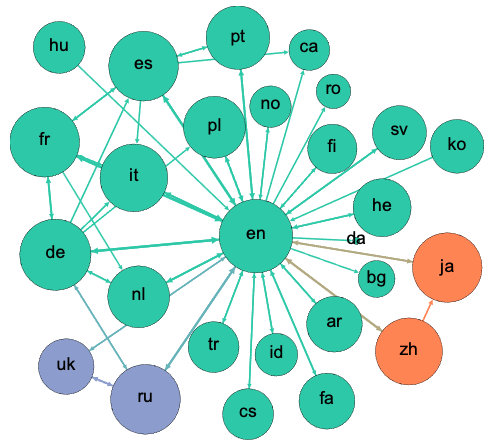
Above is a network graph of co-editing patterns on Wikipedia. Nodes represent language editions of the encyclopedia and the directed, weighted edges show the log of the number of users primarily editing one language edition who edited another edition as well. Only edges with weights over 1.96 standard deviations above the mean are shown. Colors indicate communities found by the infomap community detection algorithm.
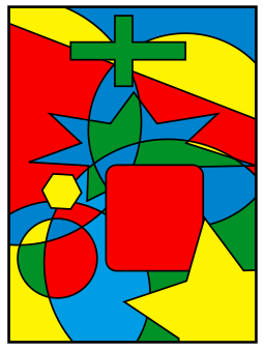
A four-color map example
Now, ask yourself: In the language editorial network visualization, can I see any edges?
The answer (for my part) is: No, I see no edges, but I see plenty of relationships.
And then ask yourself: In the four-color map, can I see any edges?
The answer (for my part) is: Yes, all the regions of the map have edges between themselves and other regions.
Here is a possible clue to an explanation of the semantic discrepance:
To resolve the coloring problems, mathematicians drew graphs, like the one above. And guess (I think) what is going on: To them, the lines are edges, because they represent edges between regions on the map. So the “edge” term stuck in the mathematical world, dominated by topological and geometrical applications of graph theory. But the lines in the graph are not edges themselves. They represent relationships between regions (i.e., the meaning of the edges is to be borders between regions).
Getting the semantics right is of essence – also in the summer!
That is walking on the edge for you! Don’t fall over …