


If you are preparing for a Data Analytics interview, this article provides you with just the right resource. We have collected the top 20 Data Analyst interview questions and have provided likely answers. This will help you get ready for an interview.
General Data Analyst Interview Questions
These questions are general questions to check your Data Analytics basics.
1. What is Data Analytics?
Collecting data from different sources, cleaning it using various tools, technologies & algorithms, analysing and generating meaningful insights for business problem solving or improving customer experience/engagement or enhancing business growth is data analytics.
2. What is the difference between Analysis and Analytics?
Analysis and Analytics have more or less the same meaning & used in different contexts.
Analysis – Analysis is a collection of information/data, examining it carefully, finding out patterns, trends, and characteristics of the collected data and drawing some meaningful findings to take corrective measures or mitigate the risks. Usually, this is based on historical data to assess the current situation or the problem area. The data is broken down into small components and analysed carefully to drive business decisions.
Some examples are Root-Cause Analysis (RCA) using a fishbone diagram, customer sentiment analysis using NLP & ML models, employee attrition analysis to enhance retention using statistical models etc.
Analytics– Analytics is used in the broader sense where the data is collected systematically from various sources, pre-processing the data using statistical models/mechanisms and generating some sense out of this data for business decisions. This is not only based on historical data but also on existing/current data to train the models to predict, and forecast future trends and find out unfold opportunities for business growth.
There are four types of analytics:
1. Descriptive Analytics – Describes the current situation, trends & position of the organization compared with previous year/month results.
2. Diagnostic Analytics – This analytics is deep diving into the collected data and finding the reasons behind generated trends and why something happened in which event. This will help in assessing opportunities to improve.
3. Prescriptive Analytics – This analytics prescribes the data to take corrective measures to make progress or avoid a particular event in future.
4. Predictive Analytics – It uses Machine Learning models to predict future trends, events and outcomes. It uses historical & current data to forecast accurately for better business growth.
Some examples are Sales data analytics for future trends & forecasts, disease detection & prevention, resource optimization etc.
3. Why Data Analytics is important?
In this digital world, huge data are being generated. Converting this raw data into meaningful actionable insights will help in detecting diseases, enhancing the organization’s operational efficiency & productivity, understanding customer preferences & serving them on time to have a competitive edge.
Looking into market trends & customer preferences, businesses can make informed decisions to adjust their offerings, and pricing and strategize spending.
In a nutshell, data analytics helps in making on-time, data-driven decisions!
4. What does a Data Analyst do?
Data Analyst:
- Collects & complies the data from various sources
- Pre-processing the data to remove null values, duplicates, format issues, errors and outliers to make data clean and good quality
- Does descriptive, diagnostic & prescriptive analysis of the data using statistical & ML models
- Develop reports/dashboards using visualization tools like PowerBI, Tableau or QlikView to generate insights
- Does predictive analytics based on the need or problem statement
- Communicate findings/results to stakeholders & leadership to make business decisions
5. Write some key skills usually required for a data analyst.
Key skills for data analyst:
- Python/R language
- SQL
- Excel (pivoting, formulas etc)
- Machine Learning
- Statistics
- Data Mining
- PowerBI / Tableau / QlikView
- Problem-Solving
- Critical Thinking
- Communication
- Domain knowledge like finance, e-commerce, banking, healthcare, Insurance etc
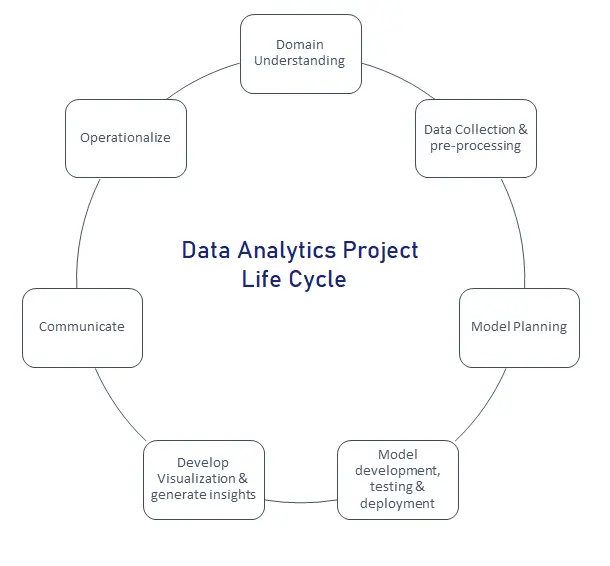
6. Explain to me the Data Analytics project lifecycle.
The Data Analytics Project Lifecycle is as below:
- Understand the domain
- Data Collection from different sources
- Data pre-processing
- Model planning
- Model development, testing & deployment
- Develop Visualization & generate insights
- Communicate
- Operationalize
Data Analyst Interview Questions – Conceptual
7. What is Data wrangling? Why is it important?
Data wrangling is one of the steps in the data analytics project life cycle. It is a process of transforming the raw (structured & unstructured), messy & complex datasets into rightly formatted ones that are suitable for analytics & Machine Learning models to generate insights that are useful for fact-based and data-driven decision-making to help business growth.
It is very important to put a proper & right foundation for any of the development for analytics. Ensuring, the foundation-level dataset is correct in the right format for appropriate data analytics. The data wrangling helps to bring different source datasets into one useful format for cross-platform data analytics.
8. What is Data Profiling?
Data profiling in data analytics is a proactive approach to examining the transformed data, analysing it from various angles and creating useful summaries & trends around the data.
This process uncovers the metadata of data to determine its legitimacy, functional dependency, relationship and data quality to overcome the bad data that usually costs the organizations. The profiled information can be used to reduce small issues in data that may cause big problems in future.
9. How have you used Excel for data analysis in the past?
Microsoft Excel is one of the commonly used tools for data analysis. It has very user-friendly options to import the data from various sources and organize & transform the data that make sense for the data analyst. Analysts can do complex calculations & manipulate data using Excel functions & formulas. Users can sort, filter, and pivot the data based on the need for analysis. Excel has built-in visualization tools (charts and graphs) & statistical functions to generate patterns and trends helping to make informed decisions.
We have used Excel by connecting directly to data sources using OLED and ODBC connections. PostgreSQL tables are quite helpful in connecting to Excel for further analytics. PostgreSQL tables are where data is stored in a structured format. Each table consists of rows and columns, similar to a spreadsheet.
10. What is the difference between Quantitative versus qualitative data analysis?
Quantitative data analytics is done on numerical/numbers using various mathematical calculations and statistical methodologies to find the patterns, trends and relationships between different features.
Some examples are financial data, ratings, clinical research, demographic data analytics etc.
Qualitative data analytics is around the examination & interpretation of non-numerical data to find out patterns, themes & senses of the data.
Some examples are case studies, surveys, interviews and feedbacks etc.
11. What are the steps involved when working on a data analysis project?
Below are the key steps in a successful data analysis project.
- Understand domain & problem statement
- Find data sources and data collection
- Data cleaning & transformation
- Exploratory data analysis using descriptive analysis, visualization & metrics generation
- Statistical analysis & hypothesis calculations
- Interpretation & Insights
- Communication with leadership on insights
- Documentation of the whole process
- Iterative improvements (continuous improvement)
Data Analyst Interview Questions – Statistics
12. What statistical methods have you used in data analysis?
Statistical methods are an important aspect of data analysis for consolidating, summarizing the data, and finding the sense of the analysed data. We used a few methods as below:
- Hypothesis Testing – This is to find out the relationship or difference between the attributes/features. Common tests like Chi-square, t-test & correlation coefficient tests are useful.
- Descriptive Statistics – To get the insights w.r.t. central tendency, dispersion, and distribution of the data, descriptive statistics is important. We used mean, median, mode, variance, standard deviation, range, and percentiles while working on it.
- Regression Analysis – Helps to find the relationship between one or more independent features and dependent features. Some examples are linear regression, logistic regression, polynomial regression etc.
- Time-series Analysis – Helps to analyse the data that is collected over time to find patterns, trends, and seasonal behaviour.
- Cluster Analysis – This is to group similar kinds of objects & features w.r.t. behaviours and characteristics. Some examples are k-means clustering, hierarchical clustering etc.
13. What is an outlier?
Outlier is a fraud, errored data, noisy data or rare-event data that is completely different from the regular or normal observations or datasets. They distort the usual patterns, and trends that lead to biased results or inaccurate insights/conclusions.
Some examples are:
1. Date of birth – 32nd May 2100
2. Age – 280 years
3. High temperature – 2000 ‘C
4. Revenue – $1
5. Height – 50 feet
14. How are outliers detected?
Outliers can be detected using various statistical methods & visualization tools.
Statistical methods – Mean, median, standard deviation, and quartiles are commonly used descriptive statistical methods to find outliers. Analysts can detect data points that fall far from the mean or median or beyond a certain threshold value.
Visualization tools – In PowerBI, Tableau & QlikView visualization tools, histograms, boxplots, and scatter diagrams are commonly used to detect outliers.
15. What is time series analysis?
Time series analysis is a statistical methodology to analyse the data that is collected over time to find patterns, trends and cyclical/seasonal behaviour that is going to help in decision making. The time intervals may be daily, weekly, monthly, quarterly and yearly.
Some examples are sales numbers, stock market trends, data centre temperature, sensor data and employee attendance or attrition.
16. Where is time series analysis used?
Time series analysis is used at various places. Some examples are:
- Sales data analysis for demand forecasting, budgeting and recruitment
- Stock price analysis for investments and withdrawals
- Demand forecasting for resource mobilization & budgeting
- Social media & survey data for sentiment analysis, trend analysis, and event triggers.
- Sensor data for preventive/predictive maintenance, anomaly detection and process improvement
- Monitoring and analysing environmental data for weather forecasting, and pollution monitoring/control
- Medical reports for the right diagnosis & clinical research
17. What are the types of hypothesis testing used today?
Hypothesis testing is to find out the relationship or difference between the attributes/features. The hypothesis test finds which statement is majorly supported by measured sample data to validate the results. There are two ways of doing hypothesis testing:
1. Null hypothesis – this test always predicts that there is a ‘null’ relation between attributes/features.
2. Alternate hypothesis – this test predicts that there is a relation between attributes/features.
These two hypotheses are mutually exclusive.
There are three types of tests as below:
1. Right tailed – to find out whether the parameter is greater
2. Left tailed – to find out whether the parameter is lesser
3. Two tailed – to find out whether there is a no-directional difference. Means, no greater or lesser.
Commonly used methods are Chi-square, t-test & correlation coefficient tests etc.
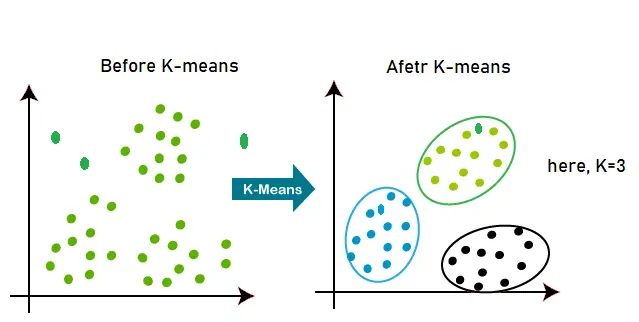
18. What is the K-means algorithm?
Clustering is an unsupervised learning algorithm that groups similar datasets into different clusters that are different from others. Unlike in ‘Classification’ where every dataset is labelled, clustering works on unlabelled datasets. K-means is one of the clustering methods. Here, K is the number of pre-decided clusters by the subject matter expert (SME) to have appropriate clusters in the process. If K=2, there will be 2 clusters, and for K=3, there will be 3 clusters.
Data Analyst Interview Questions – Career
19. What was your most successful/most challenging data analysis project?
In my current role, I have worked on one of the data analytics projects where App uninstallation was a major challenge. This has a direct correlation with App UX, app performance, customer sentiment, competition, offers, product quality & services. The key challenge in this project was working with a massive amount of unstructured data from various sources.
20. What is your plan after taking up this data analyst role?
Thanks for offering me to take this data analyst role! I am eager to use all my learnings and practical experience to solve business problems. I am continuously improving my capabilities and competencies to assist business users in getting valuable insights for making fast and data-driven decisions. I will align myself with your goals and objectives so that, I can start supporting quickly.
If there are any specific tools or areas where I should deep dive into them, please let me know. I will start looking into it. Thank you!
Conclusion
The Interview questions for Data Analysts provide you with a solid foundation for facing such an interview. The answers have been provided by a Data Analytics professional. Please note that you need to answer the questions in your own words so that the answers sound natural.
Our Data Analytics Certification course does include a Job interview preparation module which prepares you for the interviews in a comprehensive manner.

