10 June, 2024
17 mins read
17 mins read

We read about it everywhere. The term ‘big data’ alone has become something of a buzzword in recent times, and for good reason.
By leveraging the wealth of digital insights available at your fingertips and embracing the power of business intelligence, you can make informed decisions with confidence – the kind that will lead to commercial growth, evolution, and a healthier bottom line.
By implementing the right reporting tools and understanding how to analyze and measure your data accurately, you will be able to make the kind of decisions that will drive your business forward. Of course, this sounds incredible in theory.
But in practice, even if you have access to the world’s greatest data, it’s possible to make decisions that disregard tangible insight and go with your gut instead. In most cases, this can prove detrimental to the business.
While sometimes it’s okay to follow your instincts, the vast majority of your business decisions should be backed by razor-sharp metrics, facts, figures, or insights related to your aims, goals, or initiatives that can ensure a stable backbone for your management reports and business operations. Data based decision making will propel your business to new heights while making it more adaptable to an ever-changing commercial landscape. It should be at the heart of all of your strategies, activities, and operations.
To help you on your quest towards analytical enlightenment, we’re going to explore data driven decision making, study its importance, consider the benefits of developing a data driven culture, and examine some real-world examples of turning insight into business-boosting action.
Data driven decision making (DDDM) is the process of using data to make informed and verified decisions to drive business growth. By using the right KPIs and tools, companies can overcome biases and make the best managerial rulings that are aligned with their strategies.

Fundamentally, using data for decision making means working towards key business goals by leveraging verified, analyzed information rather than merely shooting in the dark.
However, extracting genuine value from your information must be accurate and relevant to your aims. Collecting, extracting, formatting, and analyzing insights for an enhanced data driven decision making process was once an all-encompassing task, which naturally delayed the entire data decision making process.
However, today, the development and democratization of business intelligence software empowers users without deep-rooted technical expertise to analyze and extract useful conclusions from their information. As a direct result, less IT support is required to produce reports, trends, and visualizations that facilitate the data decision making process.
From these developments, data science was born (or at least, it evolved in a huge way) – a discipline where hacking skills and statistics meet niche expertise. This fairly new profession involves sifting large amounts of raw data to perform intelligent data driven business decisions.
The ‘gold’ that data scientists ‘mine’ comes in two distinctive types: qualitative and quantitative, and both are critical to making a data driven decision.
Qualitative analysis focuses on data not defined by numbers or metrics, such as interviews, videos, and anecdotes. It is based on observation rather than measurement. Here, it’s crucial to code the data to ensure that items are grouped methodically and intelligently.
Quantitative analysis focuses on numbers and statistics. The median, standard deviation, and other descriptive stats are pivotal here. This type of analysis is measured rather than observed. Both qualitative and quantitative data should be analyzed to achieve smarter business decisions.
Now that we’ve explored the meaning of decision making in business, it’s time to consider why DDDM is important.
Data based decision making gives businesses the capabilities to generate real-time insights and predictions to optimize their performance. This allows them to test the success of different strategies and make informed business decisions for sustainable growth.
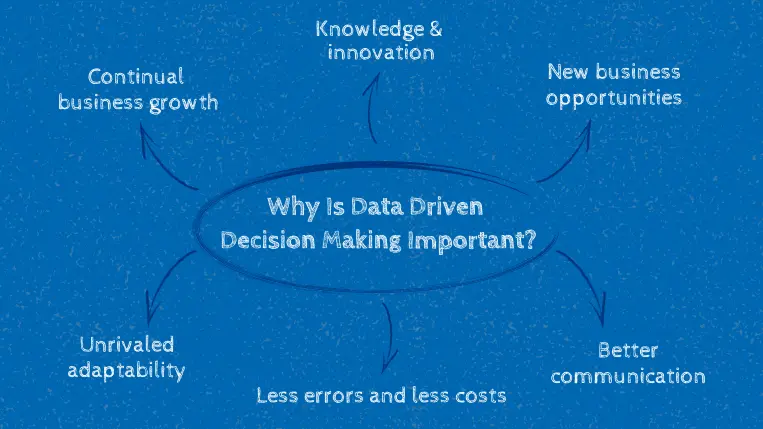
There are many reasons why using data to make decisions is a pursuit every modern business should place at the heart of its culture—and we’ll explore the main points of importance below.
The core importance of data in decisions lies in consistency and continual growth. Data-driven decision making empowers companies to hone in on key insights based on many functions, operations, and departmental activities.
One decision after another, actioned consistently, will empower you to set actionable benchmarks that result in continual progress and growth—the key ingredients to long-term success in today’s cutthroat digital age.
Data driven business decisions can determine the success of a company.
MIT Sloan School of Management professors Andrew McAfee and Erik Brynjolfsson once explained in a Wall Street Journal article that they performed a study in conjunction with the MIT Center for Digital Business. In this study, they discovered that among the companies surveyed, those primarily data driven benefited from 4% higher productivity and 6% higher profits.
Companies that approach decision making collaboratively tend to treat information as a real asset more than companies with other, more ambiguous approaches. Also, when you view digital insights as a genuine asset, you will foster a culture of data driven education – a commercial ecosystem where everyone leverages the power of information to learn more while working to the best of their abilities.
Decision making based on data leads to the discovery of new and exciting business opportunities. Drilling down into accessible visual information will give you a panoramic view of your business’s core activities, which, in turn, will ensure you make a series of solid decisions that benefit the commercial evolution of your business.
Armed with deep-dive insights that will improve your judgment, you will uncover opportunities to expand your growth, create new professional connections, and develop innovations that will give you an all-important edge over the competition.
Working with a data driven decision management mindset will make you a better leader, and that will ripple throughout the entire organization.
Whether you’re talking data driven finance, a data driven sales strategy, or any other kind of insight-driven initiative, working with powerful KPIs and visualizations will improve communication across the board.
Operating as one cohesive data driven unit, your departments will be able to share insights easily and collaborate on key strategies, ultimately turning you into a more intelligent and profitable business.
Even in 2024, many organizations still rely on intuition to make critical strategic decisions. While intuition and experience are not to be disregarded, they are no longer enough to keep up in today’s competitive business environment. Making decisions based solely on intuition can lead to mistakes that cost the business a lot of money that could be invested elsewhere.
Integrating data into your organization eliminates these issues by offering a source of accurate information to inform strategies and decisions. This way, all your resources will be allocated where it makes sense, saving you time and money.
Last but certainly not least, one of the prime benefits of data driven decision making is that it will make your business incredibly adaptable.
By embracing digital data, you stand to grow and evolve your empire over time, making your organization more adaptable as a result. The digital world is in a constant state of flux, and to move with the ever-changing landscape around you, you must leverage data to make more informed and powerful business decisions.
Data informed decision making tools will allow you to connect with emerging trends and patterns that concern your internal activities and the industry around you. If you can understand these trends or patterns on a deeper level, you can make informed decisions that will ensure you remain competitive, relevant, and profitable at all times.
Now that we’ve gained a clearer understanding of what it means to make a data driven decision as well their importance, we’re going to delve into 5 inspiring data driven decision making examples.
One of the most notable examples of data driven decision making comes from search colossus Google, according to an article written on smartdatacollective.com. Startups are famous for disbanding hierarchies, and Google was curious as to whether having managers actually mattered.
To answer the question, data scientists at Google looked at performance reviews and employee surveys from the managers’ subordinates (qualitative data). The analysts plotted the information on a graph and determined that managers were generally perceived as good. They went a step further and split the data into the top and bottom quartiles, then ran regressions. These tests showed large differences between the best and worst managers in terms of team productivity, employee happiness, and employee turnover. Good managers make Google more money and create happier employees, but what makes a good manager at Google?
Again, the analysts reviewed data from the “Great Manager Award” scores, in which employees could nominate managers who did an exceptional job. The employees had to provide examples explaining exactly what made the manager so great. Managers from the top and bottom quartiles were also interviewed to round out the data set. Google’s analysis found the top 8 behaviors that made a great manager at Google and the 3 that don’t. They revised their management training, incorporating the new findings, continuing the Great Manager Award, and implementing a twice-yearly feedback survey.
Walmart used a similar process when it came to emergency merchandise in preparation for Hurricane Frances in 2004. Executives wanted to know the types of merchandise they should stock before the storm. Their analysts mined records of past purchases from other Walmart stores under similar conditions, sorting a terabyte of customer history to decide which goods to send to Florida (quantitative data). It turns out that, in times of natural disasters, Americans turn to strawberry Pop-Tarts and beer. Linda M. Dillon, Walmart’s CIO at the time, explained:
“By predicting what’s going to happen, instead of waiting for it to happen… trucks filled with toaster pastries and six-packs were soon speeding down Interstate 95 toward Walmarts in the path of Frances.”
Walmart’s analysts not only kept Floridians pleasantly buzzed on beer and Pop-Tarts during the storm, but also created profits by anticipating demand since most of the products sold quickly.
W3O is a leading construction company in South Africa that offers all-in-one solutions in the commercial construction sector. Even with its many years of industry experience, the company struggled due to a lack of real-time control over the project’s progress and finances. While it already worked with DDDM techniques, primarily historical data and outdated spreadsheets led to inaccurate cost management strategies.
To solve this problem, the company invested in construction cost management software to eliminate manual data collection through automation and gain access to real-time insights at all times. This helped increase W3O’s operational and financial efficiency by making accurate decisions. It also helped implement efficient construction cost control strategies, increasing the company’s turnover from R200 million to a projected R800 within a year.
This case study shows how specialized software can make a business’s analytical efforts more successful.
A data driven decision holds an incredible level of value across all industries, but one sector widely known to benefit from such insights is the airline industry.
Southwest Airlines executives utilized targeted customer data to gain a deeper understanding of what new services would be most popular with customers as well as most profitable.
In doing so, the airline discovered that by observing and analyzing their consumers’ online behaviors and activities, it could provide different segments of customers the best rates for their needs in addition to an exemplary level of customer experience (CX).
As a direct result of this emphasis on data driven decisions, Southwest Airlines has seen its customer base, as well as its brand loyalty, grow steadily year after year.
Another data informed decision making case study that is wildly discussed in the industry is Amazon. The e-commerce giant uses data from customers’ past purchases paired with behavioral analytics techniques to generate accurate product recommendations for users.
These recommendations are implemented across different touch points in the shopping experience from product browsing to checkout, making the process way more personalized and efficient for the user. For example, if a customer bought a mobile phone, Amazon could recommend a phone case at checkout or via email a couple of days after the purchase was made.
By collecting individual data about their customers’ shopping preferences, Amazon is able to improve the shopping experience and boost sales and revenue in the process.
With more than 128 million active users, Netflix dominates the streaming service industry thanks to the use of data for customer retention. With the industry becoming more and more competitive by the day, the company needed to find a way to enhance its user experience and make its customers want to stay on the platform.
They did this by carefully studying different metrics related to customer behaviors and interactions such as watch time, date, location, types of shows or movies the user usually watches, as well as when a user pauses or resumes content, and much more. With this information in hand, they manage to generate an accurate recommendation algorithm to enhance the watching experience of the viewer.
After implementing the algorithm, the company analyzed the results and realized that almost 80% of users followed the recommendations. Making it a successful strategy to increase retention rates and stay competitive. An excellent example of successful data-driven decision making.
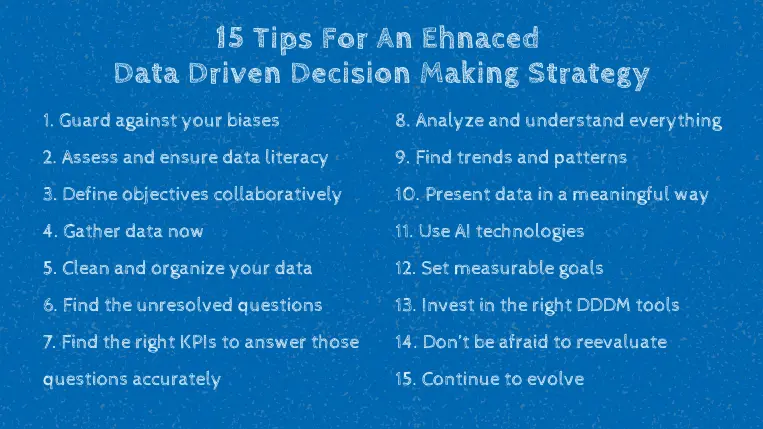
Now that you understand the importance of data-centric decision making, here are 15 practical tips and takeaways for better data based decision making in business. By the end, you’ll be 110% sold on the importance of making these kinds of decisions.
Much of the mental work we do is unconscious, which makes it difficult to verify the logic we use when we make a decision. We can even be guilty of seeing the data we wish was there instead of what’s really in front of us. This is one of the ways a good team can help. Running your decisions by a competent party who doesn’t share (or even know) your biases is an invaluable step.
Working with a team who knows the data you are working with opens the door to helpful and insightful feedback. Democratizing the analytics process empowers all people, regardless of their technical skills, to access it and carry out informed decisions. Often this is done through innovative dashboard software, visualizing once-complicated tables and graphs in such ways that more people can initiate good data driven business decisions.
With more people understanding the data at play, you’ll have an opportunity to receive more credible feedback. The proof is in the numbers. A 2010 McKinsey study (which is helpful to read even today) of more than 1,000 major business investments showed that when organizations worked at reducing the effect of bias in their decision making processes, they achieved returns up to 7% higher. When it comes to DDDM, reducing bias and letting numbers speak for themselves makes all the difference.
Tips for overcoming a biased behavior
By eliminating bias, you open yourself up to discovering more opportunities. Getting rid of preconceived notions and really studying the data can alert you to insights that can truly change your bottom line. Remember, business intelligence shouldn’t only be about avoiding losses, but winning gains.
As an extension of the previous point, in order to eliminate all biases and make sure every relevant person can work with data to improve their decision making, it is critical to assess the level of literacy across your organization. While self-service analytics tools make the use of data more accessible and user-friendly, it is still not a given.
In fact, according to Qlik’s latest data literacy survey, only 11% of the surveyed employees are fully confident in their ability to work and communicate with data. This is contrasted with 85% of c-level executives who say data literacy will be “as vital in the future as using a computer is today”.
Taking all this into account, it is clear that the need for a thorough assessment of the levels of data literacy is key to ensuring a successful analytics culture across the organization. Good practice in this regard is to identify employees who are comfortable working with data as they will be able to motivate and help others to learn. Then, you can carry out a survey where you identify issues and knowledge gaps. For example, areas where communication fails due to a lack of analytics knowledge.
Once you know the existing skill gaps you can offer training instances to help employees feel comfortable integrating data into their daily operations. Making sure these changes are applied across all positions and departments will build a solid foundation for a data-driven organizational culture.
To get the most out of your data teams, companies should define their objectives before beginning their analysis. When defining your objectives collaboration should not be ignored. Involving all departments in the planning stage can help build more accurate and attainable objectives that align with general company goals. Additionally, involving every relevant stakeholder in the process can also help define roles and responsibilities to build a solid data management foundation.
Set a strategy to avoid following the hype instead of the needs of your business and define clear Key Performance Indicators (KPIs). Although there are various KPI examples you could choose from, don’t overdo it, and concentrate on the most important ones within your industry. More on this later.
Gathering the right information is as crucial as asking the right questions. For smaller businesses or start-ups, data collection should begin on day one. Jack Dorsey, co-creator and founder of Twitter, shared this learning with Stanford. “For the first two years of Twitter’s life, we were flying blind… we’re basing everything on intuition instead of having a good balance between intuition and data… so the first thing I wrote for Square is an admin dashboard. We have a very strong discipline to log everything and measure everything.”
That being said, collecting all the data available to you is not the smartest way to go. Studies suggest that, on average, businesses gather information from a shocking 400 sources. However, just because the data is available to you, it does not mean you have to use it. Using too many sources can make the analysis process confusing and overwhelming. For this reason, defining clear goals and objectives can serve as a perfect guide to choosing only the sources that will inform your strategic plans. In that regard, implementing a dashboard culture in your company is a key component to properly manage the tidal waves of data you will collect.
When it comes to analytics, a fair share of an analyst’s time is dedicated to cleaning and organizing the information to make sure that any wrongly formatted data is out before the analysis begins. This is a critical process to perform as the results of your analysis are the basis for a successful data driven strategy and your data needs to be a hundred percent accurate.
With seemingly infinite strings or sets of data to work with, drilling down into the most relevant, valuable insights is the only way to gain clarity and make better decisions. That said, once you’ve gathered your data from your most relevant sources, taking the time to mine for the most business-boosting insights will ensure you can squeeze every last drop of value from your analytical efforts.
When you’re cleaning and organizing your data, you should focus on insights that are:
Streamline the data you’ve gathered, note your most valuable sources, and categorize your cleaned data logically – and you will be on the right path to data-driven success.
Once your strategy and goals are set, you will then have to find the questions in need of an answer, so that you reach these goals. Asking the right data analysis questions helps teams focus on the right data, saving time and money. In the examples earlier in this article, both Walmart and Google had very specific questions, which greatly improved the results. That way, you can focus on the data you really need, and from bluntly collecting everything “just in case” you can move to “collecting this to answer that.”
Among the data you have gathered, try to focus on your ideal data, which will help you answer the unresolved questions defined in the previous stage. This information will be later turned into professional key performance indicators. KPIs are invaluable analytical tools used by businesses to answer critical questions and measure the success of their strategic efforts.
There are hundreds of KPIs you can use depending on the aim of your analysis. However, as we mentioned previously in the post, just because something can be measured, it doesn’t mean it should be. Many companies make the mistake of using too many KPIs which ends up crowding their dashboards and reports and making their analysis way less productive. To avoid this happening, make sure you select around 5-8 KPIs that will help you build your data story and make efficient decisions.
That may seem obvious, but we have to mention it: after setting the frame of all the questions to answer and the data collection, you then need to read through it to extract meaningful insights and analytical reports that will lead you to make data driven business decisions. In fact, user feedback is a useful tool for carrying out more in-depth analyses of the customer experience and extracting actionable insights. To do this successfully, it’s important to have context. For example, if you want to improve conversions in the purchasing funnel, understanding why visitors are dropping off is going to be critical insight. By analyzing the responses in the open comments of your feedback form (within this funnel), you will be able to see why they’re not successful in the checkout and optimize your website accordingly.
One of the most integral parts of any effective data baked decision making process is discovering key trends and patterns. After you’ve set actionable goals and conducted some targeted testing in relevant areas of the business, you can drill down further into your newly contextualized data insights and set visual KPIs to uncover any emerging correlations, informational trends, or any patterns that may prove valuable.
For instance, if you’ve set a KPI for visualizing your customer service call resolution rates over a period of a month, and you notice a pattern of resolution rates dwindling (falling below your set target rate) towards the weekend, you will be able to examine the reasons. You might find that staff motivation rates are dropping later in the week – and roll out strategies to boost engagement or inspire motivation based on that discovery.
Digging and gleaning insights is nice, but managing to tell your discoveries and convey your message is better. You have to ensure that your acumen doesn’t remain untapped and dusty and that it will be used for future decision making. With the help of professional data visualization software, you don’t need to be an IT crack to build and customize a powerful dashboard that will tell your data story and assist you, your team, and your management to make the right data driven business decisions. For example, imagine you are in the middle of a complex construction project and need to ensure you keep track of the project’s cash flow.
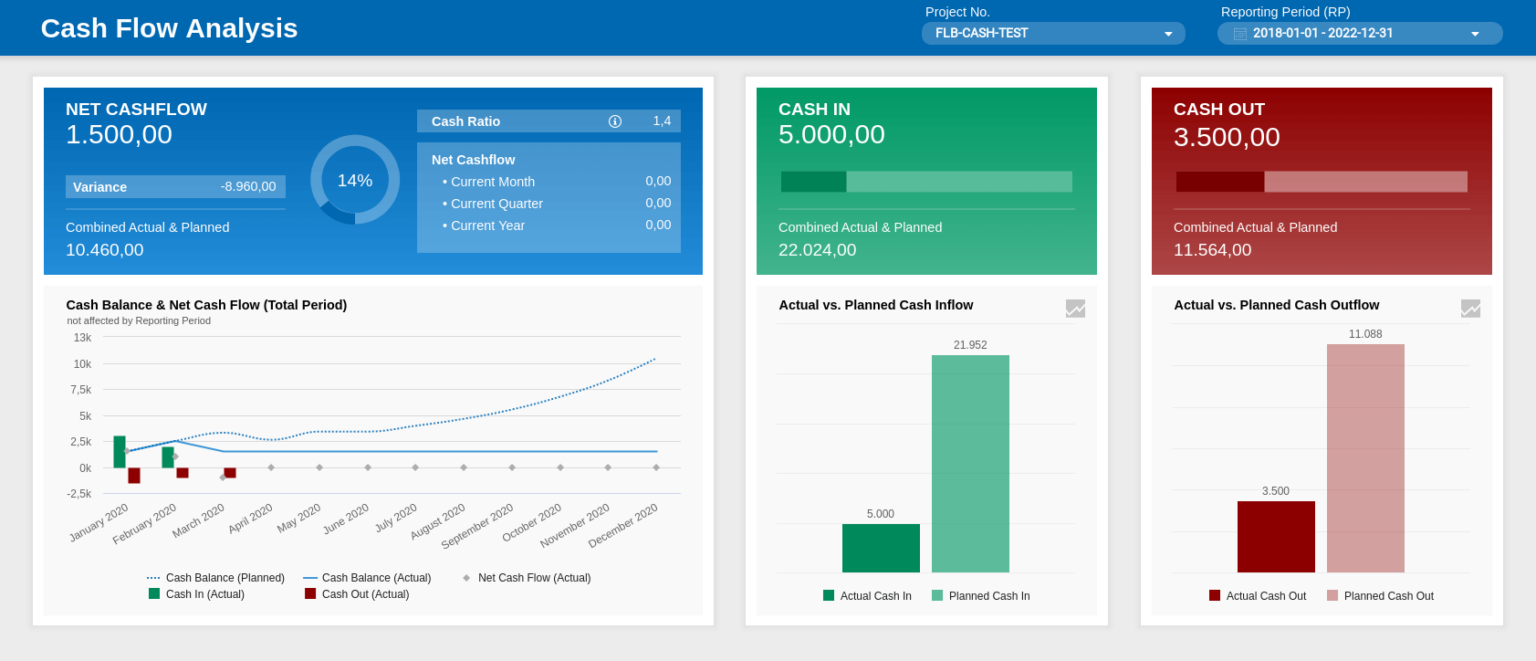
A dashboard like the one above provides all the necessary information to keep track of the money entering and leaving the project. Analyzing the cash flow carefully is important as it tells you if the project has enough cash to meet financial obligations, manage risks, and stay on schedule. The visual nature of this dashboard enables you to do just that by differentiating cash in from cash out using the colors green and red, making it easier to understand what is happening at a glance.
71% of key decision makers state that AI technologies have changed their business for the better. By working with platforms driven by artificial intelligence, you will not only boost productivity by eliminating laborious manual analytical tasks but also connect with smarter, more informed decisions faster.
AI data technologies will empower you to gather, collect, organize, present, and engage with your data with maximum efficiency, which, in turn, will accelerate your commercial growth significantly. AI-driven innovations will offer a consistently healthy return on investment (ROI) – which is priceless in the digital age.
Another productivity and ROI-boosting benefit of AI technology, when applied to data, is its ability to automate essential analytic tasks and processes to cut down on manual work and empower users to focus on using their insights to develop innovative strategies that benefit the business. Armed with AI technology, you can also set up intelligent alerts to inform you when you’ve reached a goal, when an event occurs, or when an irregularity arises. This raft of benefits will make your business smarter, swifter, and more responsive to change.
After you have your question, your data, your insights, then comes the hard part: decision making. You need to apply the findings you got to the business decisions, but also ensure that your decisions are aligned with the company’s mission and vision, even if the data are contradictory. Set measurable goals to be sure that you are on the right track… and turn data into action!
When it comes to business analytics for data driven decisions, if you want to realize your goals and make consistently informed decisions, working with the right tools is essential.
We touched on the value of AI technologies – and expanding on that point (as well as the importance of setting measurable goals), working with the right tools will make data accessible to everyone. By gaining access to a centralized dashboard that offers a wealth of digestible data-driven insight, everyone in the business will thrive, resulting in consistent growth, innovation, and profitability. These self-service analytics tools will enable everyone within the business to work with data without prior technical skills – and when everyone can leverage data to their advantage, your business will thrive.
Our brains leap to conclusions and are reluctant to consider alternatives; we are particularly bad at revisiting our first assessments. A friend who is a graphic designer once told me that he would often find himself stuck toward the end of a project. He was committed to the direction he had chosen and did not want to scrap it. He was invested, for the wrong reasons. Without fail, when this happened, he would have to start all over again to see the misstep that got him stuck. Invariably, the end product was light-years better reworked than if he had cobbled together a solution from the first draft.
Verifying data and ensuring you are tracking the right metrics can help you step out of your decision patterns. Relying on team members to have a perspective and to share it can help you see the biases. But do not be afraid to step back and to rethink your decisions. It might feel like a defeat for a moment, but to succeed, it’s a necessary step. Understanding where we might have gone wrong and addressing it right away will produce more positive results than if we are to wait and see what happens. The cost of waiting to see what happens is well documented…
This is often overlooked, but it’s incredibly important nonetheless: you should never stop examining, analyzing, and questioning your data driven decisions. In our hyper-connected digital age, we have more access to data than ever before. Make data driven education one of your organization’s key values and encourage a culture where everyone not only improves their own analytical skills but is accountable for testing, exploring, and adapting their business decisions according to the landscape around them.
To extract real value from this wealth of insights, it’s vital to continually refresh and evolve your business goals based on the ever-changing mindsets or preferences of your clients, partners, and consumers.
At this point, the importance of data in decision making is clear. However, while understanding the dynamics of data driven business decisions and exploring real-world examples will steer you in the right direction, understanding what to avoid will help you cement your success. How many times in your life have you prepared for a meeting, had the facts and figures ready to go, and in the end the decision goes the complete opposite direction?
It probably felt like the decision had been made before the meeting even began. If this sounds familiar, you are not alone. We aren’t just talking about a startup full of newbies who think going with their gut is more critical than KPIs; we are talking about huge companies. Rob Enderle, a former IBM employee and Research Fellow for Forrester, wrote a fabulous article that documents the shortcomings of executives at IBM and Microsoft.
While the article is full of examples, perhaps the most egregious is IBM’s partial sale of its ROLM division to Siemens. Enderle and the team produced an internal report that proved that selling to Siemens would be a catastrophic failure. It turned out that the decision had been made before the research came out. In fact, executives forgot the research had been commissioned at all. Their gut decision ended up costing the company over one billion dollars.
A publication from BI-Survey shows us that 58% of the companies surveyed said they base at least half of their regular business decisions on gut feeling or experience, instead of being data and information-driven. On average, they realized that the companies would use only 50% of the information available regarding decision-making.
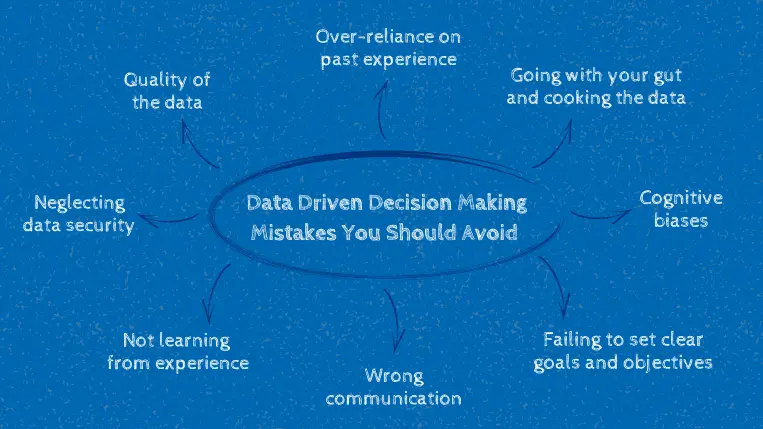
Now that we’ve outlined the foundations of getting your data driven efforts right, we will look into the common problems or challenges that data analysts and businesses might face. By observing and absorbing these key points, you’ll be able to ensure that your process is consistent, results-driven, and centered on your goals at all times.
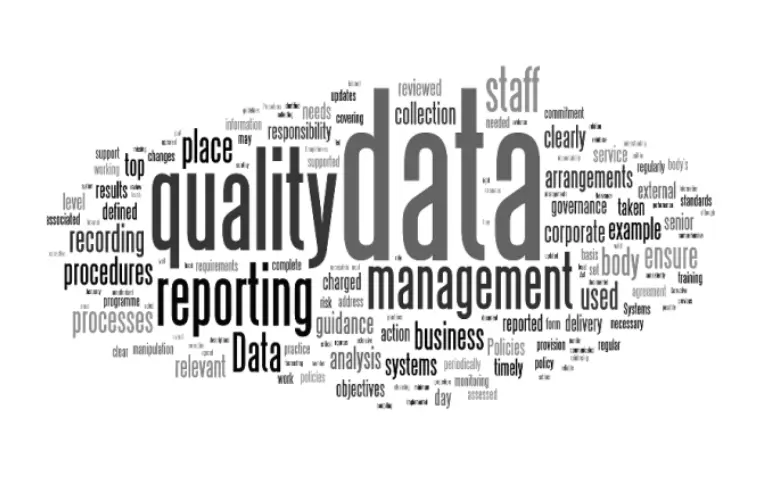
First and foremost, the main reason usually invoked is data quality. Data quality is the condition of a set of qualitative or quantitative variables, which should be “fit for [its] intended uses in operations, decision making and planning,” according to an article written by author Thomas C. Redmann. A good data quality management (from the acquisition to the maintenance, from the disposition to the distribution processes in place within an organization) is also key in the future use of such data. Collecting and gathering are only good if well managed and exploited afterward, otherwise, the assets’ potential remains untouched and useless.
Over-reliance on past experience can kill any business. If you are always looking behind you, there is a real chance of missing what is in front. So often, business leaders are hired because of their previous experiences, but environments and markets change and the same tricks may not work next time. One of the most cited examples of this is Dick Fuld, who saved Lehman after the LTCM crisis. Ten years later, he pulled out the same bag of tricks and, as the Wall Street Journal Reports, “the experience he was relying on was not the same as this massive housing-driven collapse.” The recent crisis was much more complex. Environments and markets constantly change, and to be a successful manager, one must combine past experiences with current data.
While some managers naturally follow their instincts, a significant portion first trust their gut and then persuade their researchers or an external consultancy to produce reports that confirm the decision they have already made. According to the Enderle article mentioned above, this was commonplace at Microsoft. Researchers were tasked with providing reports that lent credibility to the executives’ decisions. This should be avoided at all costs by integrating factual information into any important change or decision.
Cognitive biases are tendencies to make decisions based on limited information or lessons from past experiences that may not be relevant to the current situation. Cognitive bias occurs every day, in some way, in every decision we make. These biases can influence business leaders to ignore solid data and go with their assumptions instead. Here are a few examples of cognitive biases commonly seen:
Managers need to recognize that we are biased in every situation. There is no such thing as objectivity. The good news is that there are ways to overcome biased behavior. As a result, these businesses identify business opportunities and predict future trends more accurately, generating more revenue and fostering greater growth through data driven decision making.
We don’t want to sound like a broken record here, but we can’t stress enough the importance of setting clear goals for efficient data driven decision making. Many businesses fail because they think just gathering the data is enough. However, while having the information available is a key part of the process, the organization must put it to good use. Considering the massive amounts of collected information, defining which data will work best to help achieve general company goals is the way to go. This practice saves invaluable time to make faster strategic moves and stay ahead of competitors.
Failing to implement efficient data storytelling techniques during the decision making process is another common and very avoidable mistake. No matter how strong your analytical findings might be, if they don’t come across in the right way, they can be overlooked by high-level decision makers.
Keeping your audience engaged through interactive storytelling can lead to more productive discussions. To achieve this, use a good mix of visualizations and narrative structure when presenting your findings. Another good practice is considering the audience’s level of literacy. Making sure in advance that the language used in your storytelling is comprehensible and engaging is key to success.
In a perfect world, all your data driven business decisions will be successful. However, this is only sometimes the case, and ignoring bad results can significantly damage your process. To avoid this happening, make sure you implement a learning process for each of your strategic decisions, positive or negative ones. This will help you understand what could be improved and what needs to be replicated in the future.
The important thing to learn here is that while data analysis software has advanced a lot in the past decades, human intervention is still necessary to uncover its full potential. If we don’t learn from the information our own data is hiding, your entire analytics journey will likely be for nothing.
Security and privacy should be at the forefront of your analytical strategies. Much of your data contains sensitive information about your business and your clients. This sensitive information is protected under strict regulations like the GDPR and the CCPA, which means a data breach could not only hurt your reputation and profitability but also put your company in a really difficult position with the authorities.
To prevent this from happening, you should invest in software that not only helps you manage your data but also keeps it secure with a range of functionalities like encryption or role management options. Additionally, you should implement a data governance plan to ensure transparency and accountability regarding access, manipulation, and data sharing. Implementing data ethics training for employees is also a good way of tackling this challenge.
When you have to make a data driven business decision, dashboards may play a crucial role. Having all the historical and current data on a single screen, with the possibility to interact and dig deep into single KPIs or generating an overview of a department or company, dashboards will enable a holistic outline of important information. To see this in practice, we will now take a look at some of the selected examples.
Construction projects are complex, with many moving parts that must be connected to ensure successful completion. In the past, decision-makers in the industry relied on their intuition and experience to carry out projects. This often led to issues as the different areas were disconnected. Today, with the rise in demand and competition, they can no longer afford to do that. With so many solutions and technologies out there, companies that don’t use them to their advantage will simply stay behind. Professional construction reporting tools assist by offering advanced analytical functionalities and 24/7 access to real-time data represented in interactive dashboards. Let’s explore our example below.
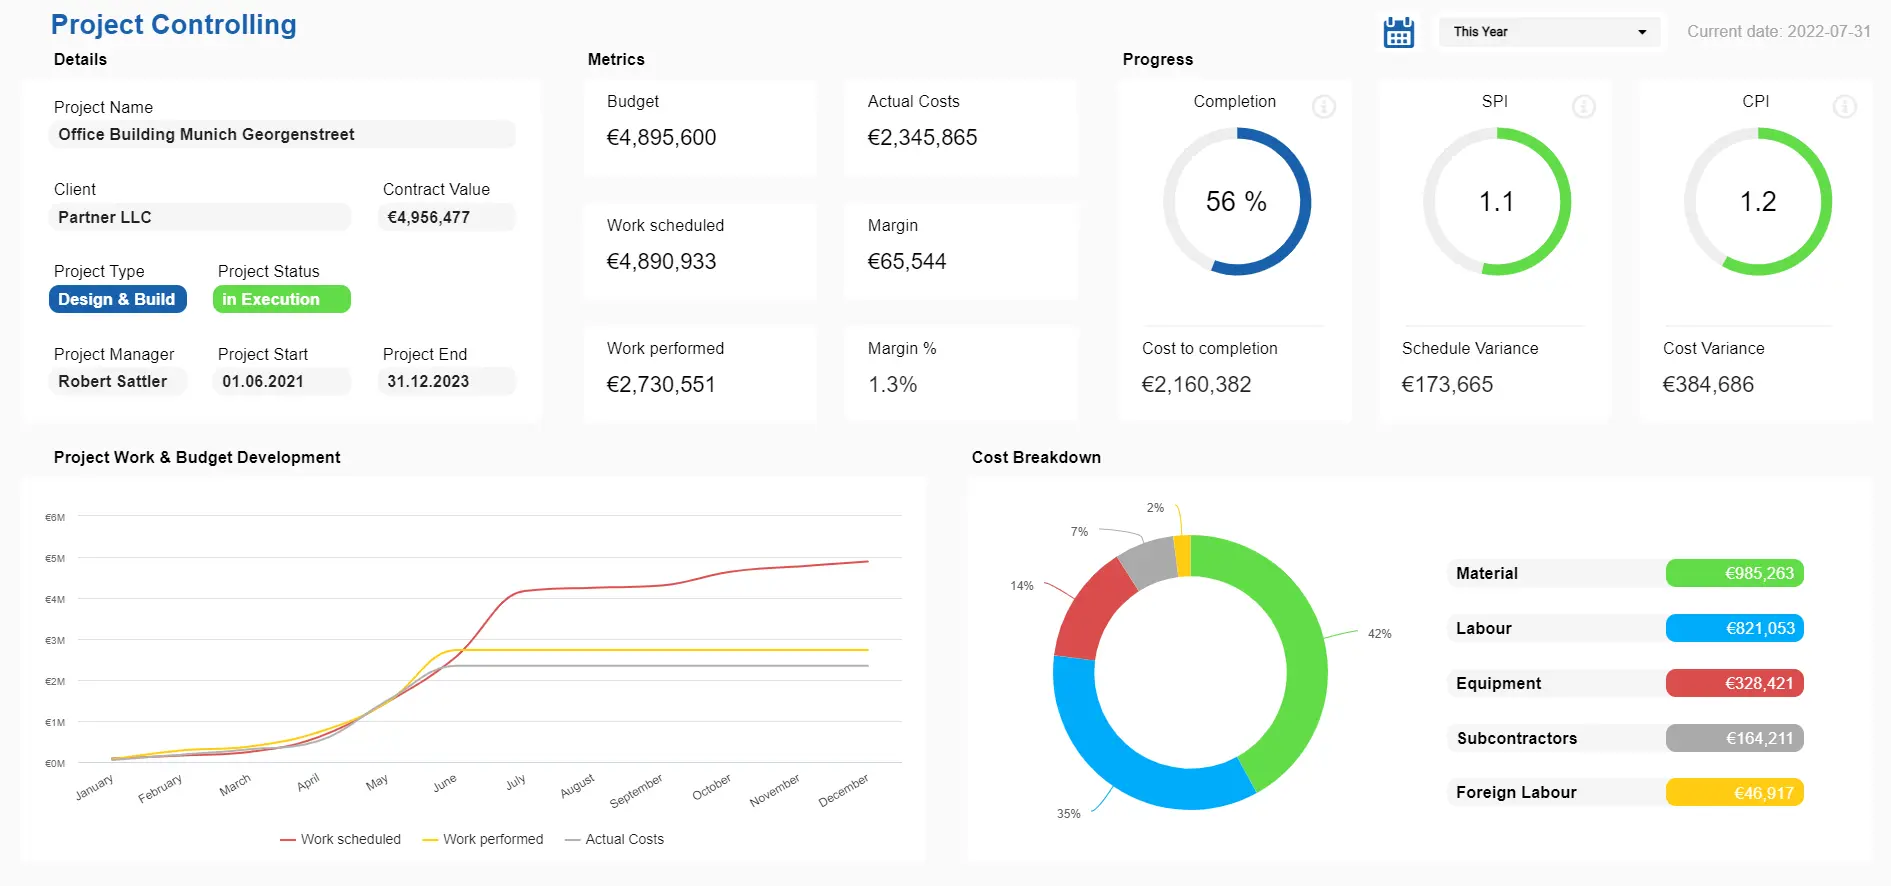
A highly visual and interactive dashboard like the one presented above offers the perfect overview to boost construction project management. The template starts by providing details about the project, such as the name, the client, the type, and the status. It continues with an overview of financial metrics to understand if everything is running as expected. The project and budget breakdown line chart below helps provide context to the financial metrics and extract deeper insights to improve them.
The progress section of the dashboard shows the CPI and SPI ratios compared to the project’s completion percentage. The CPI and SPI are fundamental performance indicators for the efficiency of construction projects. The goal should always be to keep them at a ratio of 1, which means the project is developing as expected in terms of budget and schedule. A ratio lower than 1 means something needs to be fixed.
Our second example is a strategic dashboard for a construction enterprise that manages multiple projects. The template, generated with professional construction analytics software, is filtered to show only the projects with an initial start date of the last two years but could also be filtered to show all projects or just one for deeper analysis. Let’s explore it in more detail below!
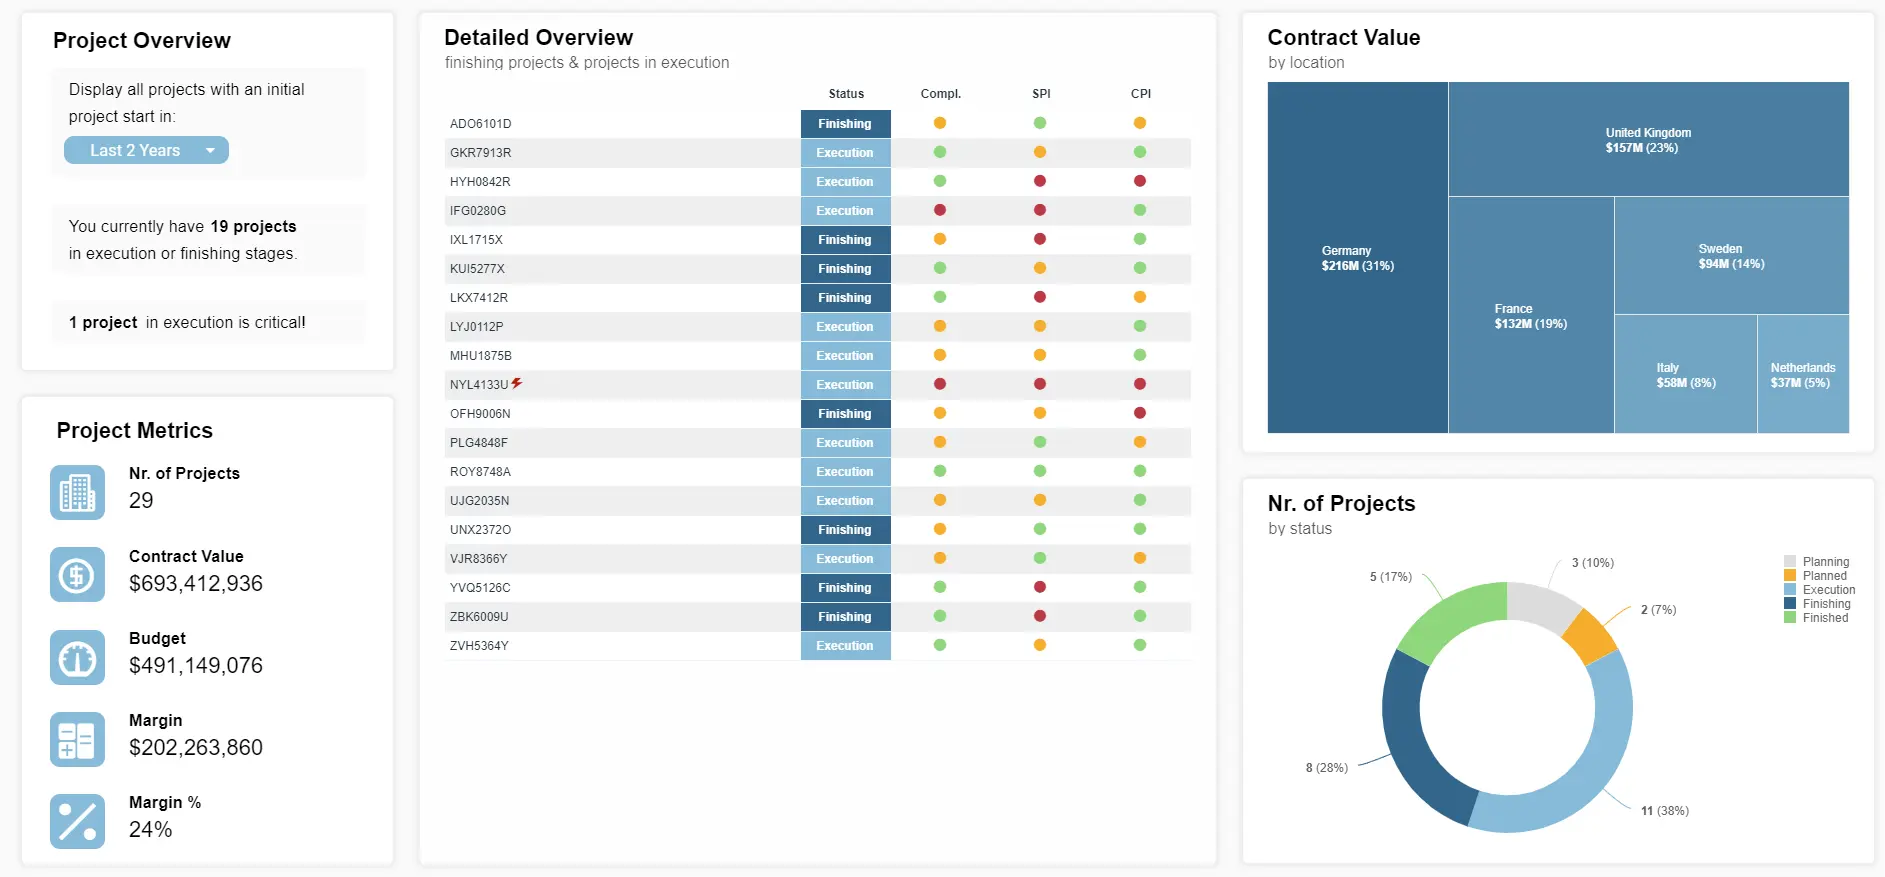
Probably the most valuable part of this dashboard is the detailed overview of finished projects and projects in execution. High-level decision-makers might not have the time to go into each project to see if it is developing as expected. Therefore, having this overview can help them spot the projects that need more attention based on the colors of the CPI and SPI, which, as mentioned in the previous example, are two of the most important KPIs for project efficiency. Here, we can see that project “NYL4133U” is red in all three metrics, which means there are some serious issues going on that might require urgent attention. On the contrary, project “ROY8748A” has all three indicators in green, which means everything is running smoothly and as expected.
A visual financial report representing how data drives decision making in finances helps those responsible for the monetary health of an organization to assess and mitigate fluctuating trends and patterns.

With at-a-glance insights into vital fiscal aspects including working capital, cash conversion cycles, and vendor error rates, here, you can drill down into potential financial inefficiencies swiftly and tackle the issues head-on. Armed with comprehensive information based on your current assets and liabilities, it’s possible to make decisions that affect the fiscal fluency of your organization with pinpoint precision. Working with a financial dashboard of this kind, it’s also possible to manage your external partnerships, including vendors, and remedy any relationships that are draining your business’s efficiency or financial health.
Data driven decision making in business facilitates the development of innovative strategies within various departments – sales are no exception.
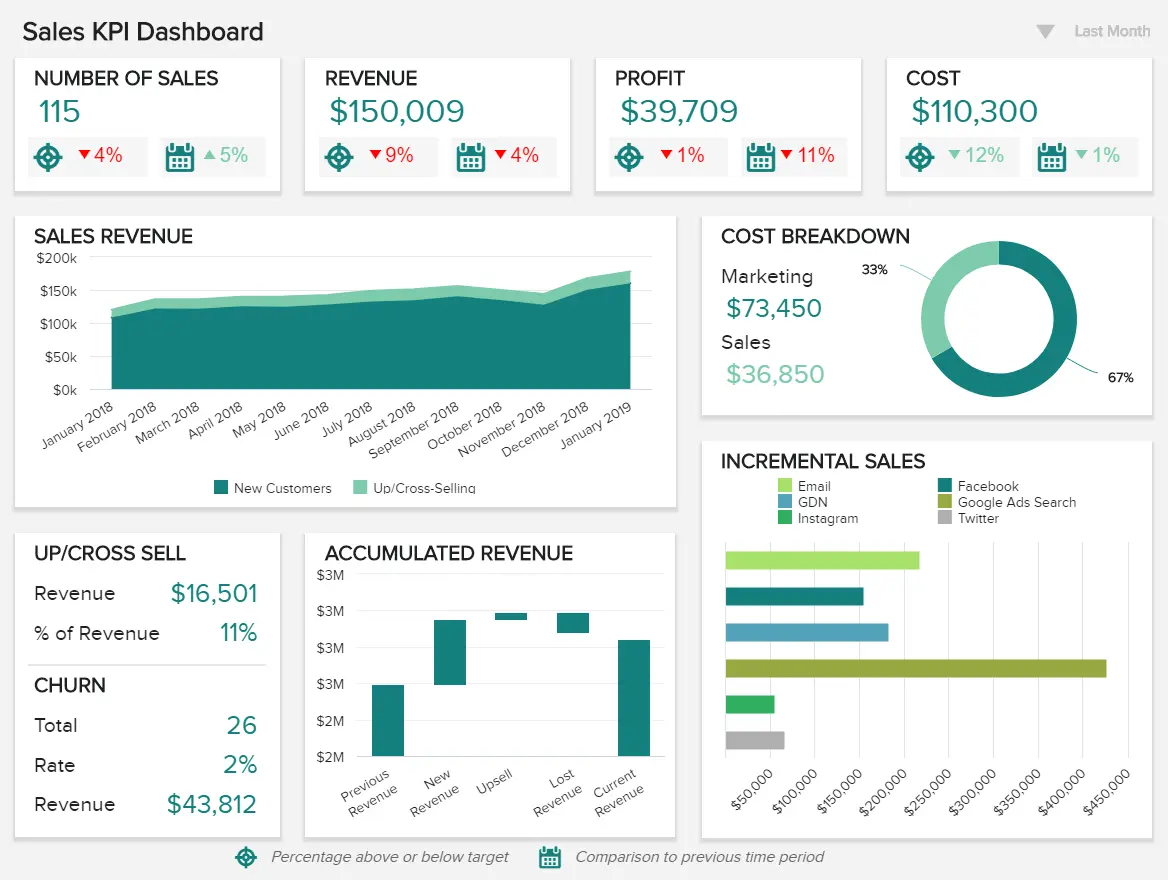
This sales dashboard is equipped with all of the data visualizations and KPIs required to optimize upselling or cross-selling initiatives, track incremental sales per channel, break down sales & marketing costs accurately, monitor revenue, and analyze your profits with ease.
Even during your busiest periods, this highly visual dashboard will empower you to make informed, value-driven decisions under pressure. Also, this melting pot of visual insight will allow you to uncover emerging patterns and adjust your sales strategies to engage a wider audience while enjoying a better ROI from all of your prospecting activities.
As you’ve learned throughout this post, DDDM is here to stay. Every day, more organizations realize the potential hiding behind their data and are willing to invest in the best software and technologies to use it to their advantage. Some of the trends that are ruling the market at the moment include artificial intelligence and the cloud. Let’s explore them below!
Hyper-personalization: The one-size-fits-all approach that has been widely used by organizations is being replaced by customization. Innovative companies are using data like browsing history and demographics to provide their customers with personalized offerings that enhance satisfaction and retention. This might sound like a big investment but it has already shown positive returns for many companies.
Transition to the cloud: On-premises solutions are being replaced by cloud-based software with enhanced data storage, scalability, flexibility, and cost-efficiency. Cloud-based solutions offer businesses real-time insights, enhanced collaboration, and accessibility that make analyzing data a much easier and more productive process.
Democratization of data: Departmental silos are eliminated thanks to enhanced data accessibility across the entire organization. Using self-service tools, all employees, regardless of their technical knowledge, can integrate data into their workflows, ensuring everyone in the company works from a single source of information. That being said, it is important to ensure some level of training is provided so a minimum literacy level is assured.
Explainable AI (XAI): Artificial intelligence is now widely used to make a business’s DDDM process more efficient and accurate. However, there are still a lot of concerns regarding the use of AI, and many organizations refrain from using it out of fear or lack of understanding. Explainable AI (XAI) is an emergent trend that was born out of the necessity to trust and understand AI algorithms. XAI is a set of processes and methods that allows users to understand and trust the input provided by an AI model by telling them how it came to that result. It explains the model’s accuracy, fairness, and transparency and helps validate AI-powered decision making.
We’ve explored several compelling examples of data driven decision making, and there’s no denying it – by harnessing data in the right way and measuring your success, you stand to propel your business to new and exciting heights.
Now that you have access to all of the key ingredients to make the best data decisions for your business, it’s time to put your plans into action. Remember – for maximum success, you must avoid taking the wrong approach to data driven business decisions at all costs. A failure to do so will lead to making choices with your gut, and biases, or fostering a poor data culture within your organization.
At RIB Software, we are committed to helping construction companies manage their projects with the right technologies, which includes data management. Our specialized construction analytics software, RIB BI+ offers centralized access to all project data with an intuitive interface that boosts efficiency and collaboration. If you are ready to integrate data into your workflows, book a demo today!


Ebook