
Statistics is a fundamental pillar for extracting meaningful insights from complex datasets. It makes acquiring inferences from enormous amounts of data easier. Dealing day and night with data, data scientists need powerful tools and methodologies that would ease the work while performing accurate analysis. Offering the right insights into patterns, trends, predictions, and decision-making, statistics for data science is valuable for testing hypotheses, quantifying uncertainties, and contributing to robustness and analysis reliability.
Fundamentals of Statistics
Data science refers to dealing with data. Statistical analysis helps in enhancing predictability, pattern analysis, and concluding and interpreting the data. The two fundamental statistics concepts that play a key role in data science are descriptive and inferential statistics.
Descriptive Statistics
It includes the method for summarizing and describing the main features of a dataset. The different measures of central tendency involved in descriptive statistics include mean, median, and mode. Besides, dispersive measures such as range, standard deviation, and variance are also included to provide a comprehensive overview of the data’s characteristics.
Inferential Statistics
This part of statistics concerns using sample data for inferences or predictions about the population. It includes using hypothesis testing to assess the validity of assumptions or claims about the population. The concept is also helpful for constructing confidence intervals to estimate the likely range of values for population parameters. Inferential statistics are of significance in decision-making.
Why Does Statistics Matter in Data Science?
The importance of statistics for data science and statistics for data analytics is immense. Exploring it through the below-mentioned points:
- For description and quantification of data
- For data identification and conversion of data patterns into usable format
- To collect, analyze, evaluate, and conclude the results for data using mathematical models
- Organize data while spotting the trends.
- Contributes to probability distribution and estimation
- Enhance the data visualization and reduce the assumptions
Statistics for data science also has industry-specific importance, as enlisted below:
- Useful in risk assessment, fraud detection, and portfolio optimization. It also contributes to forecasting market trends, modeling financial data, and making investment decisions.
- Statistics aids in healthcare through clinical trials, patient data analysis, and identifying the treatment effectiveness.
- It helps evaluate teaching methodologies, assess student performance, and improve the curriculum and educational policy.
- Retailers benefit through inventory management, demand forecasting, and customer segmentation. It aids in ensuring keeping up with optimal stock levels according to the requirements, improving the pricing strategies, and enhancing the overall customer experience.
- Manufacturers also benefit through process optimization and quality control through defect identification, reducing downtime, and improving efficiency.
- It assists in environmental studies for ecological monitoring and climate modeling to support conservation efforts and build environmental policies.
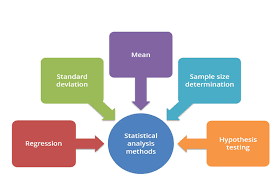
The Fundamental Statistics Concepts for Data Science
Statistics and data science merge to give innovative data analysis platforms. Here are some key concepts that help in learning these:
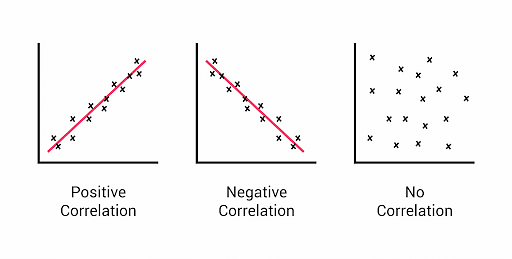
Correlation
Correlation in statistics and data science measures the directions and strength of linear relationships between two variables, with values ranging between -1 to 1. The relationship is important for feature selection, which leads to selecting the variables relevant to predictive models. It also helps to avoid multicollinearity, which prevents problems in model interpretability.
Become a Data Science & Business Analytics Professional
- 28%Annual Job Growth By 2026
- 11.5 MExpected New Jobs For Data Science By 2026

Data Scientist
- Add the IBM Advantage to your Learning
- 25 Industry-relevant Projects and Integrated labs
11 monthsCaltech Post Graduate Program in Data Science
- Earn a program completion certificate from Caltech CTME
- Curriculum delivered in live online sessions by industry experts
11 months
Here's what learners are saying regarding our programs:
A.Anthony Davis
Simplilearn has one of the best programs available online to earn real-world skills that are in demand worldwide. I just completed the Machine Learning Advanced course, and the LMS was excellent.
Charu Tripathi
Senior Business Intelligence Engineer, Dell Technologies
My online learning experience was truly enriching, thanks to the exceptional faculty. The faculty members were always available, ready to assist and guide me through challenging topics, fostering a conducive learning environment. Their expertise and commitment were evident in their thorough explanations and willingness to ensure every student comprehended the subject.
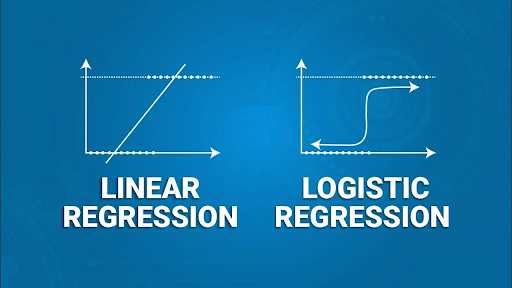
Regression
It analyzes the model relationship between dependent and one or more independent variables. The aim here is to find the best-fitting line or curve to indicate the relationship. It also contributes to predictive modeling based on the input variables. It also helps to understand the impact of variables on the outcomes, thus positively affecting the forecasting procedure. It is of two types: linear and logistic regression.
Bias
Bias refers to the errors in data or models that lead to the inclination of results in a specific direction rather than making them unbiased. It arises due to algorithmic inefficiencies, measurement, and sampling. Addressing the bias contributes by ensuring fairness and accuracy, which further improves decision-making and produces discriminatory outcomes. They are of three types: selection, confirmation, and time interval bias.
Event
An event in statistics for data science refers to the occurrence or outcome of interest and is used commonly in probability theory to describe the likelihood of specific outcomes. These are important for probability calculations for making predictions, quantifying uncertainties, and understanding the likelihood of different outcomes. It also plays certain roles in risk assessment and decision-making. Further, there are dependent and independent events.
Statistical Analysis
It is the analysis of statistical data, which is further interpreted as data analysis and interpretation using statistical tools and techniques. It comprises descriptive and inferential statistics along with other techniques. The importance is seen in hypothesis testing, pattern identification, data exploration, and making informed decisions. It also contributes to evidence-based decision-making.
Regular Distribution
The bell curve or normal distribution is the symmetrical probability distribution characterized by a specific shape. There are two parameters here: mean and standard deviation. The distribution is essential for data science to analyze different scenarios like measurement errors, test scores, and heights. The regular distribution simplifies the calculations and is foundational in hypothesis testing, inferential statistics, and parameter estimation.
Statistical Software Used in Data Science
The statistics for data analytics are commonly performed through software. Here are some highly crucial ones:
Excel
It is the most common spreadsheet software necessary for data analysis. It is used to manage, organize, and visualize datasets using graphical tools, bars, and charts. It also performs mathematical and statistical calculations with efficient representation of the same. Excel contains Analysis ToolPak that covers variance, statistical analysis, and regression.
R
It is an easy-to-learn and open-source programming language. R is used for statistical computation and graphics, data visualization, and manipulation. It is also used in exploratory data analysis and offers a rich ecosystem of packages for machine learning.
Python
It is the widely used programming language which is again easy to learn. Python plays a role in software and web development and data analysis. It streamlines, visualizes, models, and analyzes data through built-in data analytics tools and libraries like SciPy, NumPy, Pandas, and others for statistical analysis.
MySQL
It is an open-source RDBMS or Relational Database Management System used by popular apps. The application secures the data, performs routine data analysis, and manages and manipulates structured data. MySQL is mainly concerned with data storage, retrieval, and preprocessing. The relational databases are organized into tables. The SQL used with MySQL facilitates data extraction, transformation, and loading (ETL) processes.
SAS
SAS, the abbreviated form for Statistical Analysis Software, serves analysis such as advanced analytics, business intelligence, and predictive analytics. It is used to retrieve, analyze, report, and visualize data. It has an intuitive Graphical User Interface (GUI), making it easy and accessible for usage.
Jupyter Notebook
The open-source web application shares ‘notebooks’ or computational documents containing codes and data. It can also create equations, narrative text, live codes, and others. The Jupyter Notebook is vital for writing and running code, data visualization and cleaning, and performing statistical analysis.
Conclusion
Data science career is currently at its peak owing to the fourth industrial revolution of artificial intelligence. Looking for a career in the field requires gaining skills and knowledge. With career opportunities in top MNCs, a curriculum focussing on both education and hands-on project experience is a must.
Simplilearn brings forward specifically curated courses by experts. We offer a Data Science Career Bootcamp Program of 8 months designed in a self-paced learning format to help you level up your prep for your dream job!
Frequently Asked Questions
1. What statistics are needed for data science?
The most important statistics needed for data science are descriptive and inferential statistics, along with probability.
2. What are the branches of statistics?
There are multiple branches of data science, such as descriptive, inferential statistics, biostatistics, econometrics, probability theory, multivariate statistics, bayesian statistics, time series analysis, and regression analysis.
3. What is the importance of statistics in data science?
The importance of statistics in data science is for descriptive understanding, modeling relationships, inference and decision-making, the probability for uncertainty, validity, and reliability.
4. Can I learn statistics for data science online?
Yes, multiple platforms offer courses. However, seeking the best one with all the right offerings is recommended. For instance, look for hands-on training in projects, industry-specific expert guidance, hybrid learning mode, and coverage of all the important concepts and skills relevant to the domain of interest.
Become a Data Science & Business Analytics Professional
- 28%Annual Job Growth By 2026
- 11.5 MExpected New Jobs For Data Science By 2026
Data Scientist
- Add the IBM Advantage to your Learning
- 25 Industry-relevant Projects and Integrated labs
11 monthsCaltech Post Graduate Program in Data Science
- Earn a program completion certificate from Caltech CTME
- Curriculum delivered in live online sessions by industry experts
11 months
Here's what learners are saying regarding our programs:
A.Anthony Davis
Simplilearn has one of the best programs available online to earn real-world skills that are in demand worldwide. I just completed the Machine Learning Advanced course, and the LMS was excellent.
Charu Tripathi
Senior Business Intelligence Engineer, Dell Technologies
My online learning experience was truly enriching, thanks to the exceptional faculty. The faculty members were always available, ready to assist and guide me through challenging topics, fostering a conducive learning environment. Their expertise and commitment were evident in their thorough explanations and willingness to ensure every student comprehended the subject.