

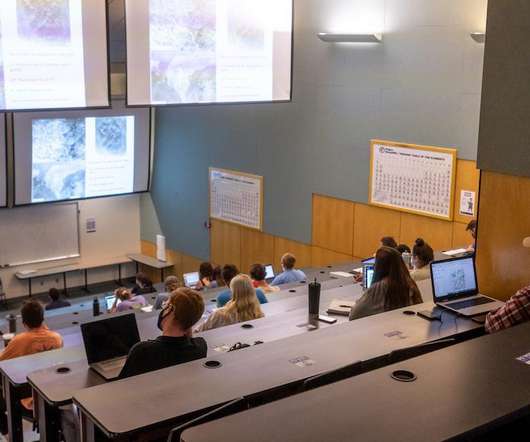
Back to school: JMU parent helps improve university’s COVID-19 dashboard
Tableau
FEBRUARY 17, 2021
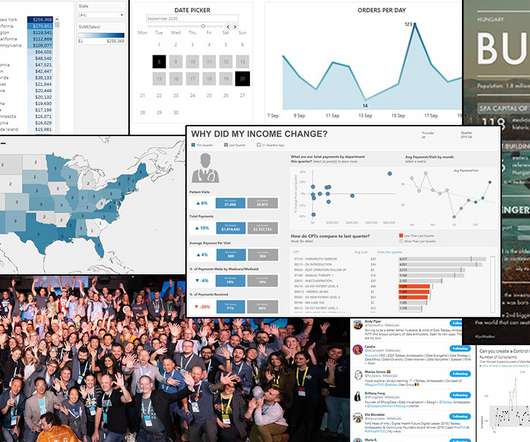
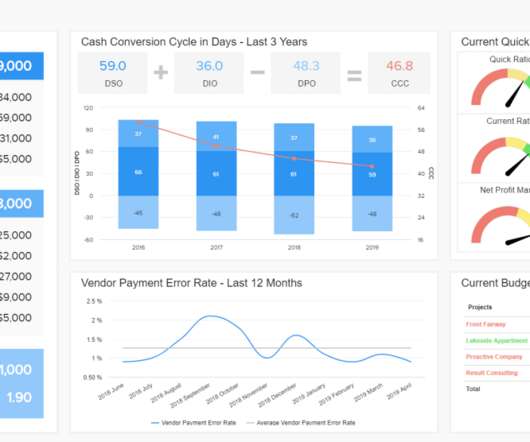
Data visualization is a collaborative exercise. JMU’s commitment to data transparency, through both university- and self-reported cases, has contributed to more than 540,000 views of its COVID-19 dashboard as of February 2021. . In 2012, Feinberg founded DecisionViz , management consultants specializing in data visualization.


Let's personalize your content