article thumbnail

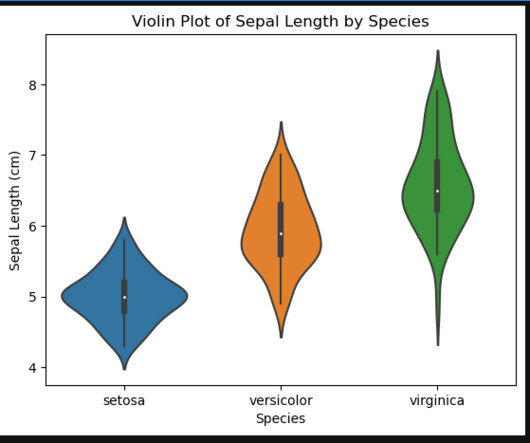
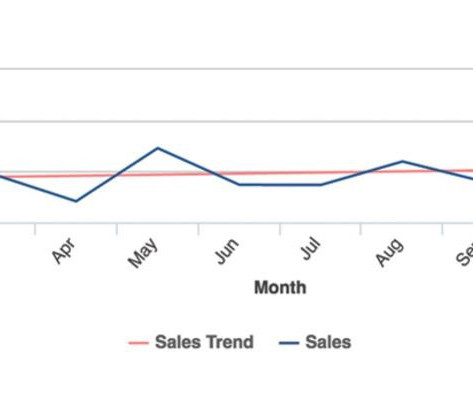
Exploring Iris Data Visualization with Seaborn’s Violin Plot in Python

Analysts Corner

Introduction Data visualization is an essential skill for anyone who wants to explore and understand large datasets. One of the most popular libraries for data visualization in Python is Seaborn. In this article, we will focus on understanding how to use Seaborn’s violin plots to visualize the Iris dataset. What is Seaborn?

article thumbnail

Modernizing Computer Vision With Neural Networks – Applications & Analysis

Marutitech

As simple as the term seems, computer vision is a complex technology and a critical factor in the rise of automation. There are many computer vision applications – from facial recognition, object recognition to image restoration, motion detection, and more. How are Neural Networks Modernizing Computer Vision?

Vision 98
Insiders

Sign Up for our Newsletter

This site is protected by reCAPTCHA and the Google Privacy Policy and Terms of Service apply.

article thumbnail

Take a Visualization MasterClass with 'We Feel Fine'

Juice Analytics

My first stop for data visualization inspiration is Jonathan Harris’ We Feel Fine. This is why I come back again and again for design concepts and engaging data visualization techniques that reach any audience. I love the realization of this vision. Careful use of color Harris uses color to bring energy to his visualizations.

article thumbnail

Social BI and Visual Analytics Go Hand-in-Hand

ElegantJ BI

To encourage social BI, you must give users intuitive visual analytics and smart visualization tools to help them easily see, analyze and share data. Sophisticated, easy-to-use visual analytics is the foundation for social BI and data democratization!

article thumbnail

Sharing a strategic vision: Step one for behavioural change

Clarasys

On average, 95% of a company’s employees are unaware of, or do not understand, its strategic vision. Before there can be any effort to implement behavioural change, there must be a well-articulated vision to inform and justify it. Gaining buy-in on a strategic vision. The transformational (vision-oriented) leader.

Vision 52
article thumbnail

Social BI and Visual Analytics Go Hand-in-Hand

ElegantJ BI

To encourage social BI, you must give users intuitive visual analytics and smart visualization tools to help them easily see, analyze and share data. Sophisticated, easy-to-use visual analytics is the foundation for social BI and data democratization!

article thumbnail

Social BI and Visual Analytics Go Hand-in-Hand

ElegantJ BI

To encourage social BI, you must give users intuitive visual analytics and smart visualization tools to help them easily see, analyze and share data. Sophisticated, easy-to-use visual analytics is the foundation for social BI and data democratization!