


We are going to discuss an exciting part of visualization, which is very appealing to our eyes. So, We are going to learn about different types of plotting on maps.
For instance, maps help us to analyze geographical data by plotting 3D data on a 2D plane. So, To plot 3D Earth points on a 2D map, we need to put together latitude and longitude to plot the point.
Uses of Maps
Maps are usually used when we want to answer a spatial question using the data that we have. Hence, There are many examples like quickly analyzing the crime rate in parks, flight routes, cyclone paths, busiest train lines in the city, road structure in the city, and much more.
But many times, some questions can be answered quickly using other types of visualizations. In this case, it is important that you vigilantly choose the visualization that can give clear answers quickly. You can ask yourself this question: Can any other visualization give me the answer faster? If yes, choosing a map may not be the best option.
You can use maps if you are sure that:
- The data will be correctly represented.
- Inferences can be quickly and accurately deduced.
- The data shown on the map is not misleading.
- The data shown on the map is not misleading.
Know more about our Certified Business Data Analytics (CBDA) Training, Tableau Certification program, PowerBI certification program, Data Analytics Certification with Excel programs.
Types of Maps
We will look at different types of maps with case studies to get exposure to different uses of maps.
Proportional Symbol Maps
They are used to show quantitative values on a map. So, To create a proportional map, you need latitude, longitude to plot the points on a map, and the quantitative value.
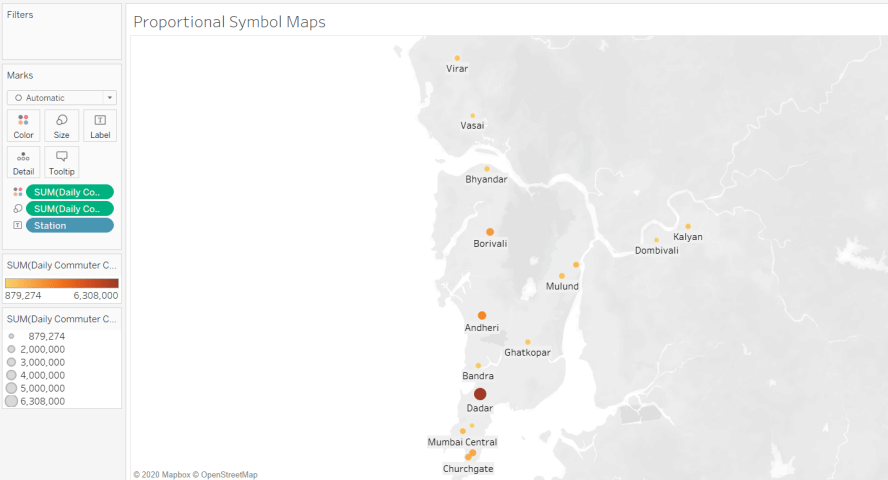
Figure 1 shows the daily commuter count of the railway stations in Mumbai for two lines, central and western. The size of the bubbles and the color represents the count. The bigger and darker the bubble, the higher is the count. We can also compare two quantitative values using color and size.
Choropleth Maps
They are filled maps useful for analyzing spatial trends. You can map aggregated or ratio data. The color varies based on the aggregated data being presented. To create a choropleth map, you need latitude, longitude to plot the points on a map, and quantitative or qualitative value.
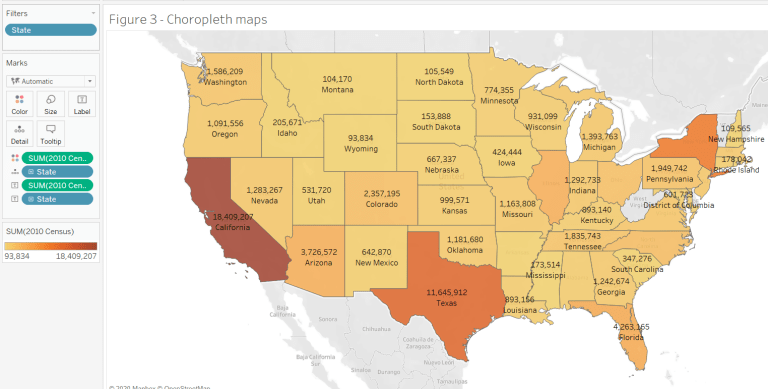
Figure 2 shows us the population in 2015 in different states of the United States. We can see how the color is changing based on the population with California being the most populated state.
Heat Maps
Also called density maps, they reveal patterns or concentrations in the map that may be hidden otherwise due to overlaps. Overlaying points are grouped and color-coded to display the intensity. So, They are usually most helpful to see concentrations in a small area. To create a heat map, you need the latitude and longitude.
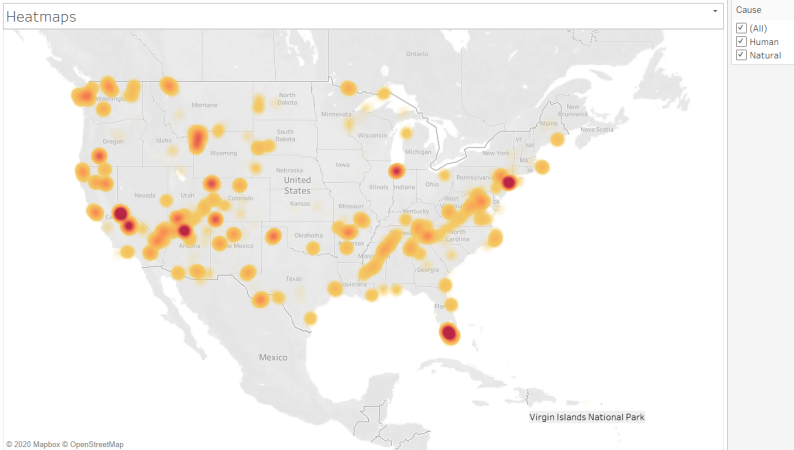
Figure 3 shows the spread of wildfires in the United States in different states.
For instance, You can zoom into California or Florida, which show maximum wildfires. There you can see how Fireid of many locations is grouped. You can filter through the cause as well.
Point Distribution Maps
In these maps, a single dot represents an observation in the data. The granularity of data is maximum, and also a large number of data points are required. These maps are used in order to identify clusters in the data. To create a point distribution map, you need the latitude and longitude for all the locations in the data.
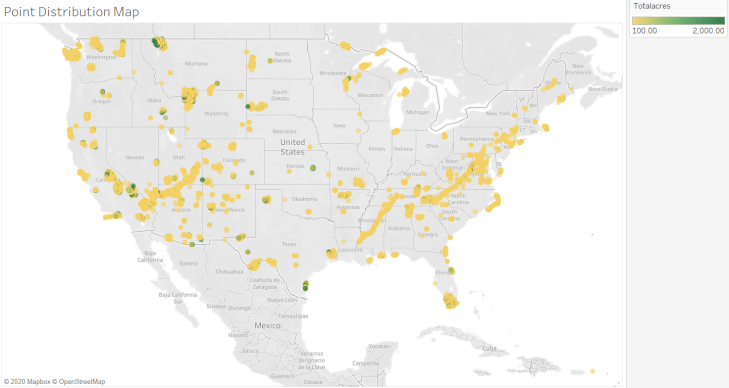
Figure 4 shows us the total acres of wildfire in different states. Each location is plotted in the map in order to help us identify clusters; hence, we can see one cluster in Montana, one in south Texas, California, Wyoming, Idaho, Kansas, and Florida.
Path Over Time Maps
They are also called path maps, as, in these maps, we show how the path over time is changing. Hence, To plot a path overtime map, we need latitude and longitude for points in the path, a unique id for the path, and enough data points across days and time to plot on the map.
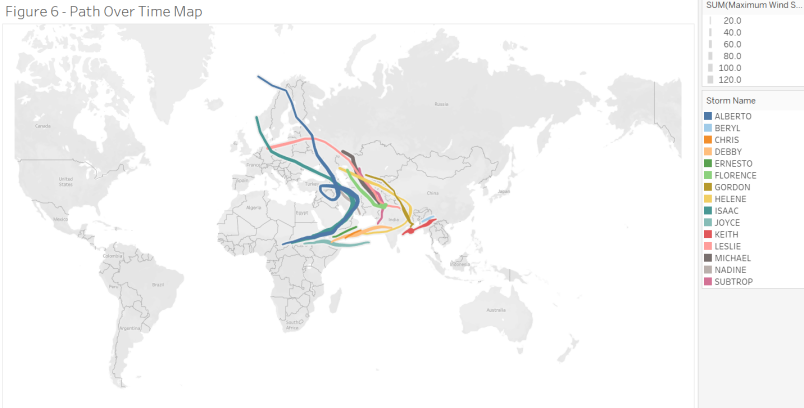
In Figure 5, we can see different hurricanes in the year 2000 and their wind pressure. The different colored lines show the path of the hurricanes, and their thickness shows the maximum wind speed.
Conclusion
We can thus conclude that we choose maps as our type of visualization when we create accurate and aesthetic visualizations. So, Various data trends can be displayed in maps which makes them interesting to plot and analyze.
Learn more from our articles on Tableau, Data Visualization, or by browsing the full collection of articles in the data-analytics category.

