Reviewed and fact-checked by Sayantoni Das
Microsoft Excel is a widely used application especially in Business Analysis, but it can be a little confusing when it comes to removing and eliminating duplicate data. Removing duplicates in Excel is a prevalent task for people working on huge datasets. When you combine different tables, or when many people have access to the same document, you might end up having repeated entries in your spreadsheet. Thus, making the data redundant. The larger the dataset, the higher are the chances of encountering duplicate records. It can be problematic if they are not identified and handled correctly.
We will illustrate how to remove duplicates in Excel using a Sports dataset. This dataset contains information about Olympic medalists for the year 2012.

Find and Remove Duplicates
Duplicate data is sometimes useful, but it often just makes the data harder to understand. Finding, highlighting, and reviewing the duplicates before removal is better than removing all the duplicates straightway.
- Select the range of cells containing duplicate values that should be removed. Note: The best way to remove duplicates is to remove any outlines or subtotals from your data.
- By selecting Data > Remove Duplicates and then checking or unchecking the columns you wish to purge, you can remove duplicate records.
- Then click OK.
How to Remove Duplicate Values in Excel
Excel has a built-in tool that helps delete repeated entries in your dataset. Let’s have a look at the steps to be followed to remove duplicates in Excel.
- Step 1: First, click on any cell or a specific range in the dataset from which you want to remove duplicates. If you click on a single cell, Excel automatically determines the range for you in the next step.

- Step 2: Next, locate the ‘Remove Duplicates’ option and select it. DATA tab → Data Tools section → Remove Duplicates

- Step 3: A dialog box appears, as shown below. You can select the columns you want to compare and check for duplicate data.
In case your data consists of column headers, select the ‘My data has headers’ option, and then click on OK.
On checking the header option, the first row will not be considered for removing duplicate values.

- Step 4: Excel will now delete the duplicate rows and display a dialog box. The dialog box shows a summary of how many duplicate values are found and removed along with the count of unique values.

- Step 5: As you can notice, the duplicate records are removed.

Let's move forward and understand how to remove duplicates in Excel using the Advanced Filter option.
Understand Filtering for Unique Values or Removing Duplicate Values
With an objective to obtain a list of unique values, you can either filter for unique values or remove duplicate values. The tasks serve a common purpose. However, there is a critical difference. On filtering for unique values, the duplicate values get temporarily hidden, while the option of removing duplicate values permanently deletes duplicate values.
Also, it is crucial to understand that a comparison of duplicate values relies on what appears in the cell rather than the underlying value contained in the cell. For instance, if two cells with the same date value are formatted as “3/9/2022” and “Mar 9, 2022”, they are regarded as two unique values.
Therefore, make it a practice to check before removing duplicates. Try to filter or conditionally format unique values to get the expected results.
Filter for Unique Values
Take the following steps to filter for unique values:
- Begin by selecting the range of cells. You will have to ensure that the active cell is in a table.
- Next, you must locate and select the Advanced filter option in the Sort & Filter group.
Data tab → Sort & Filter section → Advanced.

Sort & Filter Option
3. The Advanced Filter popup box will appear on your screen. You can take one of the following actions:
- If you have to filter the range of cells/ tables in place, click Filter the list in place.
- If you have to copy the results of the filter to a different location, then take the following measures:
- Click the “Copy to another location” option to copy the values.
- In the “Copy to” box, enter a cell reference where the resultant values must be copied.
- You can temporarily click the “Collapse Dialog” option ( ) to hide the popup window. Then, once you have selected a cell on the worksheet, click the “Expand” option ().
- Check the ‘Unique records only’ option box and then click OK.
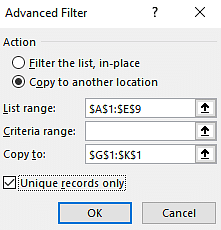
Advanced Filter Popup Box
Using the Advanced Filter Option
The Advanced Filter option in Excel helps you filter duplicate values and copy the unique values to a different location. Look at the following steps to find out how the Advanced Filter option works.
- First, click on a cell or range in the dataset from which you want to remove duplicates. If you click on a single cell, Excel automatically determines the range when you click on Advanced Filter.

- Locate the Advanced Filter option.
DATA tab → Sort & Filter section → Advanced and click on it.

- You will see a dialog box. It consists of a list of options for advanced filtering.
- Select the ‘Copy to another location’ option to copy the unique values to a different location.
- Check the range of your records in the ‘List Range’ field and make sure it is the range that you have specified.
- In the ‘Copy to:’ field, enter the range where the resultant unique values must be copied.
- Check the ‘Unique records only’ box. This step is the most crucial.
- Click on OK.

- The unique values will be copied to cell G1.

These were the in-built functionalities in Excel that help us in removing duplicates. Now, let’s move forward and learn how we can create our own function to do the same.
Also Read: The Best Guide to Understand Advanced Excel Functions
How to Use Formulas to Remove Duplicates in Excel?
We will be using a simple example containing the columns: type of sport, athlete name, and medal won to demonstrate this approach.

This method involves combining the columns using an Excel formula and finding out the count. We will then filter out the duplicate values (ones that have a count greater than 1).
- Let’s combine the columns A, B, and C by using the concatenation operator “&“. So, the Excel formula would be:
=A2&B2&C2
This formula is entered into the cell D2 and then copied down to all the rows.

- Now, we will need another column named ‘Count’ to find out the duplicates in Column D. Hence, we use the COUNTIF function on cell E2. The formula will be:
=COUNTIF($D$2:D2,D2)
This formula helps count the number of occurrences of each value in column D.

If the value of Count is “1”, then it has only appeared once and is unique. If the value is “2” or more, then it is considered a duplicate value.
- Now add a filter to the Count column by selecting the Filter option.
You will find it in the DATA tab → Sort & Filter section → Filter
Click on the filter at the top of Column E. Select “1 ” to keep only the unique values and remove the duplicates.

- On clicking OK, the duplicate values will be removed from the table. You can copy these resultant unique records and paste them elsewhere.

Let’s proceed by understanding the final approach to delete duplicates: Using Power Query.
Problems Removing Duplicates from Outlined or Subtotaled Data
A common problem when removing duplicates is that you cannot remove duplicate values from outlined or subtotaled data. To remove duplicates, you must remove both the outline and the subtotals.
article>Conditionally Format Unique or Duplicate Values
Conditional formatting helps find and highlight duplicate areas. However, Excel cannot highlight duplicates in the PivotTable report’s Values area. For other areas, follow the steps given below:
1.Begin by selecting the cells you want to check for duplicate values.
2. Next, you will have to find the Duplicate Values option under conditional formatting in the Home tab.
Home tab → Conditional Formatting → Highlight Cells Rules → Duplicate Values.
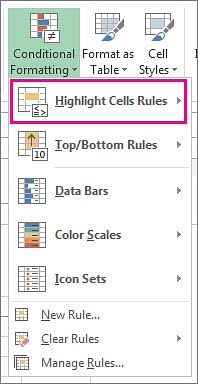
3. Once you click on the Duplicate Values option, a popup box will appear.
4. Now, in the box next to the “values with” option, pick the formatting for the duplicate values from the drop-down menu. Then click OK.
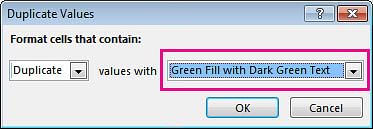
Duplicate Values Popup Box
The duplicate values will be highlighted in the sheet. Before using the remove duplicates feature, remember that it will permanently delete all the duplicate data. So, it is wiser to copy the original data to a separate worksheet to avoid accidental loss of any information.
Now take the following steps to remove duplicate values:
1. Select the range of cells with duplicate values you want to remove.
2. Next, locate the ‘Remove Duplicates’ option and select it.
Data tab → Data Tools section → Remove Duplicates.
3. Under Columns, check or uncheck the columns where you want to remove the duplicates. Then, click OK.

Remove Duplicates Option
For instance, we want to keep the January column with price information in the following worksheet.
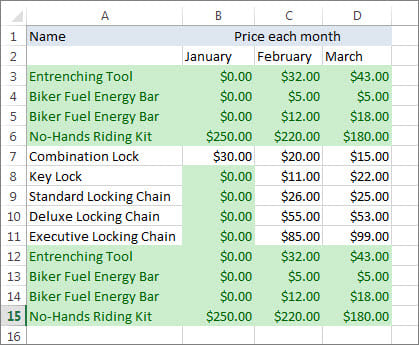
Sample Worksheet
So, uncheck the January option in the Remove Duplicates box.
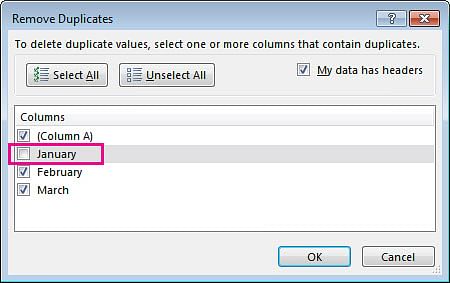
January Option Unchecked
All other duplicates will be removed except the unchecked columns.
How to Use the Power Query Tool to Remove Duplicates in Excel?
Power Query in Excel lets you import data from various sources, clean and transform your data. This tool makes it effortless to remove duplicates in Excel.
- Select a cell or range, locate Data Tab → Get & Transform Data section → From Table/Range and click on it.

- On clicking, you will see a dialog box to create a power query table. Make sure that the range of values is correctly specified. Click on OK.

- The following Power Query editor window appears.
Now you have two options. You can remove duplicates based on:
- One or more columns
- Entire table
To remove duplicates based on one or more columns, right-click on the specific column header. You can select more than one column using the CTRL button and remove the duplicates accordingly.

To remove the duplicate records based on the entire table, click on the button present on the top left corner of the data preview. And then select the ‘Remove Duplicates’ option.
This way, the data will be free from duplicate values.

On clicking the ‘Close & Load’ option, the data will be loaded onto your spreadsheet.
Conclusion
In this write-up, we learned various approaches to delete duplicate records. Whether you’re interested in learning the basics of Excel, or want to develop more advanced Microsoft Excel skills, Simplilearn has a Business Analytics For Strategic Decision Making for you. It is the pefect course to help you get started on your journey to becoming a Business Analyst.
Please feel free to post any questions in the comments section of “How to Remove Duplicates in Excel?: A Step-By-Step Guide” article. Our experts will get back to you on the same, at the earliest.
