How Can Smart Data Discovery Tools Generate Business Value?

Table of Contents
2) Why is Data Discovery So Popular?
3) Data Discovery Tools Attributes
We live in a time where data is all around us. In the digital age, those who can squeeze every single drop of value from the wealth of data available at their fingertips, discovering fresh insights that foster growth and evolution, will always win on the commercial battlefield.
Studies suggest that 79% of enterprise executives believe that companies that do not leverage big data in the right way will lose their competitive position and could ultimately face extinction. Moreover, 83% of executives have pursued big data projects to gain a competitive edge. Without a doubt, the best way to drive maximum value from the metrics, insights, and information is through something called data discovery.
Fundamentally, this is a term that describes the process through which businesses collect information from a variety of sources and apply it practically to generate real value. Businesses can benefit from improved data driven decision making as well as enhanced business processes and models and share insights across departments more fluently while propelling intelligent strategies.
Being a data-driven organization starts with understanding your data. Whether you’re talking about an IT specialist, a CIO, or a project manager, in today’s digital age all business users need to be able to access and understand data.
This methodology is an analytical approach that supports success and ensures that everyone within an organization is empowered to make the most of the information in front of them by understanding it in a seamless, interactive way.
So, what is data discovery? What are the tools used for such a task? What is a data discovery platform and how do you use it in a real-world business context? Here, we explore all of these themes and more, starting with the most important question of all.
We offer a 14 day free trial. Benefit from modern data discovery today!
What Is Data Discovery?
Data discovery is the process of collecting data from various sources in order to detect patterns and outliers from it. With the help of data discovery tools and visual data navigation, businesses can gain insight and answer critical questions to drive success.
Let’s say that you are a business owner, an analyst, a CIO, or a program manager. Everyone employed in the organization needs a way to read, understand, and glean value from all the information that is coming in in the form of data.
Deriving value from data in a modern business environment is crucial for any company’s success. The ability to discover as well as analyze patterns and trends enables businesses to provide themselves with a competitive edge, meet goals, ensure success, and remain relevant in the digital era.
As mentioned, the concept itself is not a tool; it’s more of a term that can be utilized to generate business value. That said, there are data analysis tools that you can use to enhance your efforts.
This level of discovery can be described and categorized by:
- Data preparation: The process of managing unstructured raw data for various sources and transforming it into a usable format.
- Visual analysis: The visual tools that allow users to understand and interact with the data and extract actionable insights from it.
- Guided advanced analytics: This category allows businesses to get a complete picture of their data thanks to a mix of reporting and visual techniques. It allows users to find patterns and relationships for improved decision-making.
That said, the process can also be broken down into two types of data discovery. Basically, the main difference between the two is that one requires more technical knowledge, whilst the other has a more user-friendly approach that is accessible to the average user. Let’s see them in more detail.
Manual data discovery: This type means that all the heavy work of preparing and cleaning the data is done by expert analysts and scientists. Before advanced technologies such as machine learning, specialists needed to use critical thinking to manage their data efficiently.
Smart data discovery: On the other side, smart discovery has an automated and user-friendly approach thanks to the use of software that allows for preparation, integration, and analysis through interactive data visualizations. This has allowed the average business user to start using data in an intuitive and fast way. This post will mostly focus on the smart type of discovery.
The following sections, with the help of BI-Survey’s guide, offer an in-depth analysis of the inner workings of the trend and explains why enterprises are using it so successfully.
Big Data Discovery: Why Is It So Popular?
Now that we’ve explored the definitive data discovery definition for your reading pleasure, let’s delve into this innovative concept as a trend with its main benefits.
As we mentioned at the beginning of this article, the big data industry has shown exponential growth in the past decade. Studies say that more data has been generated in the last two years than in the entire history before, and that, since 2012, the industry has created around 13 million jobs around the world. The power to predict patterns and connections has improved the way multiple businesses work, making it one of the biggest industries worldwide and one of the hottest trends of the moment. Let’s see why.
- Improved decision-making: Data is considered an invaluable commodity and “currency” for businesses. It helps companies derive trusted insights that they can apply to their competitive advantage. It improves the decision-making process, powers growth strategies, significantly boost the customer experience, and enables organizations to drive innovation with their business models.
- Accessibility: In the modern world, IT or data expertise should not be a requirement to extract business insights. This is why intelligent data discovery is so important in today’s context. This trend has accessibility at its core, by providing the necessary tools to make important data points understandable for any type of user. Empowering them to use data to support any important decision.
- Improved risk management: Working with data doesn’t come without risks, as the volumes grow so does the need to keep it protected and compliant with law regulations. With the help of data discovery tools, companies can spot any potential threats and tackle them immediately as well as ensure compliance.
- Saves time and money: Time is of the essence when it comes to analytics. In the past, users had to wait days to get a report with outdated information. A data discovery platform provides automated features as well as real-time data access. These two functionalities combined, allow organizations to save money and time that they can spend actually optimizing their processes based on the insights they extracted from the analysis.
But how do you begin adopting this mentality? How do you implement this type of strategy into your organization, and what visual analytics tools are available that can help facilitate this process?
First of all, you can track your business performance thanks to specific metrics – Key Performance Indicators – and get all the insight that your data has to offer. There are many KPI examples you could choose from, depending on your industry and/or department. Then, you can apply the information gleaned across all teams and departments, which will enable you to make collective decisions that will ultimately solve challenges and create sustainable solutions in a number of key areas.
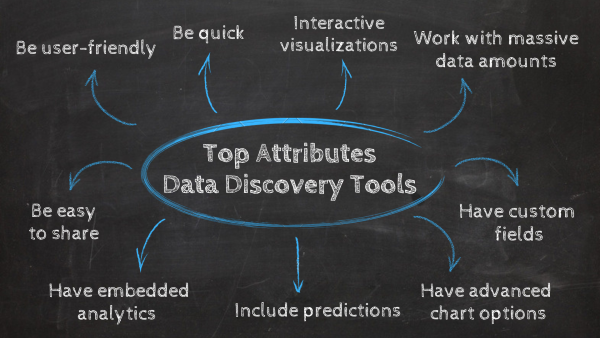
Top Attributes You Should Look For In Data Discovery Tools
There are tools that currently exist in the form of business intelligence software – platforms that have been specifically designed to improve traditional BI capabilities.
Previously, we mentioned the three data discovery steps: data preparation, visual analysis, and guided advanced analytics. The software for discovering the data, that you use, should provide the very foundations for these three crucial stages. Here we leave you a list of the main attributes that these kinds of tools should include:
1) Be user-friendly
In the past, data discovery and analysis processes were left to professional analysts or IT experts to deal with. Today, thanks to modern technologies and the democratization of data this has changed. One of the principles of any modern tool is that it needs to have a user-friendly interface. This will empower everyone in your organization to take advantage of the information and the tools available to them.
2) Be quick
With the growth of data in the past years, so has grown the offer of online data analysis tools available in the market. With many businesses benefiting from these solutions, you need to make sure you invest in technologies that will provide a competitive advantage to your business. That said, you should choose software that is quick and provides the needed functionalities to help you understand exactly where to focus your efforts. For instance, automated reporting allows you to generate dashboards and reports with real-time data in a matter of seconds.
3) Easily work with massive amounts of data
Visual discovery is helping expand traditional business intelligence and improve efficiency. If you have multiple databases from different touchpoints, you should look for a tool that will allow easy integration no matter the amount of information you want to include. Besides connecting the data, the discovery tool you choose should also support working with big amounts of data. For example with advanced filtering options or pattern recognitions.
4) Have interactive visualizations
The human brain processes visuals much faster than numbers. For this reason, a quality data discovery tool should include powerful and interactive visualizations that will make the process of working and analyzing the information smooth and easy to understand. Tools such as datapine, offer a dashboard creator that includes a wide range of predefined templates with different chart types and colors that will enable anyone in your organization to tell a story with the data. In the image below we leave you an example of a finance dashboard displaying the main metrics needed to understand the financial health of a company at a first glance.
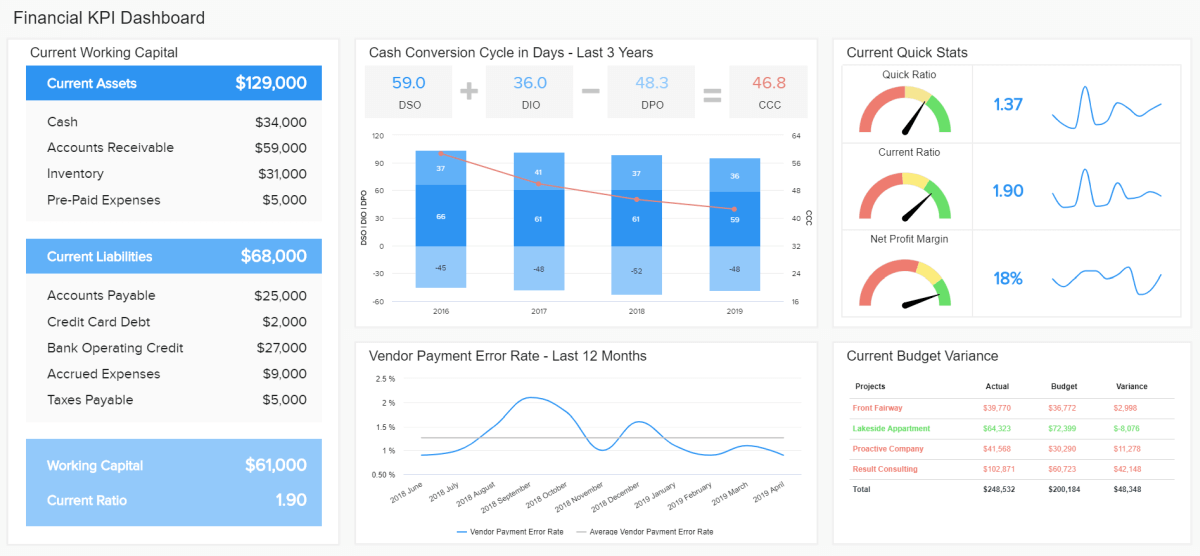
**click to enlarge**
5) Have advanced chart options
Apart from interactive visualizations, a well-developed software should contain advanced chart options to perform quality analysis and extract the maximum potential from your data. Some of these advanced features should be:
- Being able to combine multiple chart types into one.
- Add a secondary axis to enable advanced comparison and analysis.
- Have different trend indicators like colors for positive or negative outcomes.
- Allow conditional formatting to point out unexpected values and discover hidden trends or patterns.
- Use comparison period features to compare data from two different periods and draw conclusions based on performance and targets.
6) Have custom fields
Custom fields are another important feature to look for. They allow users to create individual calculated fields as well as combine multiple category dimensions into a merged field with the help of different join types. Professional dashboard tools such as datapine offer custom fields that can easily be created with a drag & drop function.
7) Include predictions
Predictive analytics functionalities are a must when it comes to investing in these solutions. By using artificial intelligence and machine learning technologies to analyze current and historical data, users can easily identify patterns and trends that can be used to answer a set of critical questions. Generating accurate performance predictions allows companies to prepare in advance for future developments in a smart way. Of course, the mentioned functionality needs to provide a user-friendly interface that allows even non-technical users to visually explore data and generate predictions.
8) Be easy to share
Collaboration is a fundamental point for successful data management. Therefore sharing capabilities is one of the attributes you should expect to find when investing in BI software. datapine allows you to provide different types of access to stakeholders based on their roles and the data they need to use. Being able to easily share insights and reports will increase communication between teams leading to a more productive environment. In addition, you can plan a sharing schedule and automate the process to make sure clients are getting the information they need in time.
9) Allow for embedded analytics
Expanding on the point above, another great functionality is embedding capabilities. Now that more and more organizations are aware of the power of a collaborative data-driven environment, the need to implement functionalities that bring people and data together becomes critical. In that sense, embedded analytics serves as a bridge to make this happen by enabling the integration of interactive dashboards with all their functionalities into internal and external applications that users can easily access from any location. Like this, embedded dashboards can significantly increase the speed and ease of data discovery.
In summary, you don’t have to be an expert analyst or read programming code to understand and derive value from the data within your business. A solid data discovery tool should make it possible for people to read and understand patterns across all departments and share this information with one another. Whether you're extracting and evaluating HR KPIs or preparing specific retail performance metrics, the right tool must be able to adjust to your specific organizational needs.
To develop a real modern business environment within your organization, you must implement the discovery of data so that you can remain relevant, and successful, and facilitate a data-driven culture. If you fail to do so, you won’t be able to keep up with the demands of the digital world. If you can’t learn how to get the most from your data, your business will fall behind.
That said, there are essential steps that you should take to ensure that your efforts become ingrained within your company culture. Let’s explore them in more detail.
We offer a 14 day free trial. Benefit from modern data discovery today!
How To Perform Smart Data Discovery?
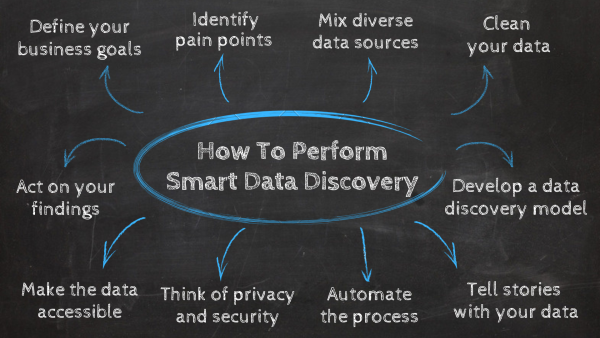
1) Define your business goals
The first step to performing smart data discovery is to define your business goals, this way you will keep your process focused on the right information. For this purpose, you can meet with your key stakeholders and team members and start a conversation to define the primary strategic goals for the business and the metrics you will need to keep track of progress and measure success.
This stage of the process is also beneficial to keep everyone in the company involved with data discovery methods and processes and build a strong data-driven culture in your organization.
2) Identify your pain points
After defining your goals comes the time to identify your pain points or the obstacles that prevent you from becoming a smarter, more intelligent business entity. While every organization is inherently different and one size certainly doesn’t fit all, there are a host of pain points that often cross over from one organization to another. Here are a few examples:
- Access to large sets of information within your organization is somewhat limited and sluggish.
- A wealth of data from varied sources makes it seemingly impossible to gather, understand, and apply non-traditional information effectively.
- The complexity of your current systems and platforms means that users spend too much time curating, understanding, and reporting data and less time using it to drive progress and innovation.
Does this sound familiar? Implementing new and innovative BI or dashboard tool within your organization will help solve a great deal of these roadblocks (something that we will explore in more detail later), as will working your way through these steps.
3) Mix diverse data sources for deeper insights
As you know by now, data comes from a variety of sources, both structured and unstructured. By gathering insights from your existing structured and unstructured, or diverse, sources and looking at them in a different way, you stand to discover fresh insights that will drive the business forward.
By integrating your data from various diverse sources and gathering it with key members of your business in a collaborative environment, you will be able to blend these metrics and insights to piece together a puzzle of knowledge that will unlock the door to advanced organizational success.
Doing so will give you a clearer understanding of what you need to do to meet your business goals (or even uncover new ones) and set the KPIs that will help you get there as a collective pulling together, rather than separate departments working alone. For example, the process of financial reporting can be utilized by different stakeholders, be it internal (in cross-departmental communication) or external (other companies, investors, shareholders, etc.)
4) Clean your data
Once you have gathered the data from all the sources that are relevant to your business you will be left with an overwhelming amount of information to deal with. At the same time, you might be faced with incorrect data that can damage your discovery process. For this reason, you should always clean everything before visualizing it and start extracting insights from it.
You can start by adding any missing codes, fixing empty fields, eliminating duplicate observations, and incorrectly formatted data. Then you can go even deeper and clean your text data. Many businesses work with surveys, social media comments, and other text inputs that are crucial for their analysis. In order for algorithms to detect patterns, text data needs to be "cleaned" to avoid invalid characters or any syntax or spelling errors.
The final aim of the cleaning stage is to avoid the risks of working with misleading data that can damage your business. It will also help BI reporting tools to interact better with your information and perform a smart data discovery process.
5) Develop a data discovery model
What is a smart data discovery model? Fundamentally, this kind of model is a strategic approach to using your data. They typically involve the collection, curation, and analysis as well as the data-driven actions an organization takes upon the discovery of new insights that prove essential to the development of the business. Choosing the best reporting software for the job is also a big factor.
The “modeling” of these varied systems and processes often involves the use of diagrams, symbolic references, and textual information to represent the way the data flows through the business. Examples of models in terms of approach include entity-relationship diagrams, data mapping specifications, data matrices, and flow diagrams.
We’ve considered the question “What is a data discovery model?” and explored examples of these kinds of models, but the takeaway here is: To tread the path to company-wide data-driven enlightenment, you must understand your flow of information and have an organizational strategy in place to ensure it’s handled in the most cohesive way possible.
6) Tell stories with your data
One of the most effective ways of ensuring your organization is an entirely data-driven entity by being able to create an easy-to-follow, inspirational narrative with your data – one that everyone within the organization can get on board with, regardless of their technical competency.
To achieve this, the adoption of data visualization is a must, and to help you get started, here are 3 questions you should explore:
- Which types of graphs and charts should I choose and how to do so?
- What visualization books can I read to stay on top of my data storytelling?
- What kind of data visualization examples can I look for inspiration from?
If you’re able to tell a story and paint a picture with your data, you will ensure it is accessible throughout the organization, helping you build a far more cohesive and prosperous company as a result.
7) Automate your process
The next step is to use automated data discovery. As we mentioned before in our point on cleaning your data, with such big amounts of information the preparation process can be time-consuming and, most importantly, risky. Humans can make mistakes like misclassifying the data which can lead to bigger problems in the future. For this reason, turning to BI solutions with automation technologies means you will benefit from more advanced data classification techniques such as catalog-based search or patterns search. This way your data will deliver more accurate and expressive results.
Another important benefit of automation is real-time decision-making. Having all your data live and in one place will enable discussions to make accurate business decisions based on the latest information available.
8) Think of privacy and security
When you are dealing with big amounts of data, companies are obligated to consider privacy and security. This is especially true when dealing with sensitive information such as finances, customer data, or even health information for health-related companies. In fact, security has become a topic of concern in the past years with serious regulations being imposed such as the GDPR for European countries. These regulations have been created as a response to a concerning increase in data breaches. As of 2022, breaches have increased up to 21% over the past 5 years.
This step is not a burden with the help of data discovery tools. These solutions are equipped to discover sensitive data and ensure that it follows any privacy regulations. This is done by discovering and classifying datasets by their level of sensitivity, allowing the organization to apply the needed security and privacy protocols such as encryption.
9) Make the data accessible
We've stated many times through this post the importance of accessibility for successful data discovery. When we talk about accessibility we mean using user-friendly tools that anyone in the organization can use without the need for any technical knowledge, but also to be able to access it from several devices at any time. For example, the marketing team should be able to quickly access IT metrics to support their e-commerce strategies. Like this, you will build the bases for that much wanted data-driven culture and empower everyone in your organization to join.
10) Act on your findings
Once the data has been collected, cleaned, and visualized it is ready to be analyzed to extract actionable insights and improve strategic and operational decisions. Here, you can rely on the various applications we mentioned before such as predictive analytics to uncover hidden patterns that will provide a deeper understanding of certain scenarios. An important note here is to always keep evolving and rethinking your strategies. By using all the techniques and steps we just mentioned, you are set to gain invaluable knowledge about your business that will set it apart from its competitors.
Data Discovery Use Cases
So far, we’ve provided a detailed definition as well as a few data discovery best practices and functionalities you should consider using. To keep putting the value of these processes into perspective, we will now go through a couple of use cases in a business context.
Strategic planning: In general, data discovery systems can enhance many areas in strategic planning by providing access to real-time information as well as historical performance. This complete view allows users to make informed decisions considering all critical factors. For example, a CFO deciding on budget allocation for the coming year can look at departmental performance and understand where efforts and budget need to be focused the most.
Identifying customer issues: As mentioned, data discovery allows businesses to bring together data from various sources and use it in an innovative way. For instance, it allows them to gain a 360-view of everything related to their customer's behaviors and interactions. Like this, they can spot any issues such as unexpected customer churn, product issues with high returns, promotional failures, and any other sign of customer dissatisfaction. These issues can be identified with the help of technologies such as text sentiment analysis that can be used to understand what customers are saying about your brand.
Security prevention: Data breaches are becoming an increasing topic of concern and the implementation of new security regulations has forced companies to pay attention to their security and privacy efforts. Data discovery can pinpoint any gaps in security by performing automated data classification. This involves the tagging and labeling of data to easily identify non-compliant points. Additionally, it allows users to outline any suspicious activity and prevent internal and external security threats.
Social media analysis: The number of social media channels is continuously increasing, leaving companies with the challenge to adapt and learn how to use them to their advantage. Data discovery allows them to get a centralized view of relevant indicators related to customers' behaviors through interactive social media reports. This way, any issues can be tackled in real-time and efforts can be focused only on the channels that are most successful.
Machine maintenance: In a traditional manufacturing company, the only way to tackle machinery issues is by dispatching a technician to repair the equipment. This usually delays the production process and can cost the factory money and time. With the use of predictive analytics and self-service data discovery, manufacturers can analyze their historical overall equipment efficiency and identify possible failure factors that can be prevented from happening again.
This branch of BI is evolving even further as technology continues to advance, and we have to delve deeper into what’s happening within our business as we implement it. Where is it taking us, and how is it affecting the future of our organizations and our ability to make valuable decisions?
Smart Data Discovery Or Augmented Intelligence: Discover The Next Stage In Business Analytics

Organizations are adopting the use of data discovery tools that are helping improve their decision-making capabilities. We’re now seeing the concept evolve into what’s called smart data discovery, or Augmented Intelligence.
Augmented Intelligence improves business intelligence by using machine learning algorithms, data alerts, and artificial intelligence capabilities to automatically find trends and likenesses in data. This greatly improves the speed at which decisions can be made and makes it easier to obtain your information-driven insights.
Gartner is responsible for recently introducing the term “smart data discovery,” and they define it as “a next-generation capability that makes insights from advanced analytics accessible to business users or citizen data scientists.”
Later on, Gartner – a company that is a big influence when it comes to software, platforms, and tools – decided to further enhance the mentioned term and give it a more accurate representation of its capabilities, terming it as Augmented Intelligence.
To see what data discovery tools Gartner has helped to inspire as well as their insights into the field, explore this case study.
Augmented Intelligence: Augmented Analytics And Augmented Data Preparation
Gartner released a full report discussing the importance of Augmented Analytics in the future. Let’s take a further look into it.
Augmented Analytics uses machine learning algorithms and natural language processing to automate the insights that you receive from your data. Essentially, it simplifies the process of arriving at your insights by automating data preparation and further facilitating sharing across the enterprise. It speeds up the process of deriving value from your data.
Augmented Data Preparation grants people within a business access to more purposeful data so that they can test all assumptions and approaches to information-based decision-making with more confidence and ease. It promotes data quality management and governance and allows for data transparency.
Why are they important?
Here are some of the reasons that make us think that both augmented analytics and augmented preparation are vital:
- You can make more accurate predictions and solutions across departments.
- They free up more time for strategic decision-making.
- They improve data accessibility.
- They positively impact ROI (Return on Investment) and TCO (Total Cost of Ownership).
These are just some of the few benefits you can receive from intelligent augmented data discovery solutions for your business. With technology advancing so rapidly, there are new analytical solutions introduced all the time. As a professional, staying up-to-date on all the latest business intelligence trends and information is well worth it.
The discovery of data isn’t merely an optional activity in a time when businesses live and die by their commitment to data innovation. In the modern age, it is a necessity. To become truly data-driven and drive decision-making capabilities towards a successful outcome, organizations must adopt a process that facilitates collaboration between users and departments and enables the understanding of data even for those who are not data specialists.
We offer a 14 day free trial. Benefit from modern data discovery today!
Data Discovery Tools For The Modern Age

These tools provide visual presentations including geographical maps, charts, graphs, and color-coded elements to catalyze the data discovery process as well as the uncovering of patterns or trends within the data, not only in past and predictive sense but also in real-time. This organized, streamlined, and visual data typically comes in the form of real-time dashboards, reports, charts, and tables in one centralized, easy-to-navigate location.
Data discovery products and tools are the gateways to cultivating a more productive, efficient, insight-rich, discovery analytics-smart organization. Any business intelligence platform or tool worth their salt will offer all of the key attributes outlined earlier in the guide while helping you successfully cover every one of the steps necessary for ongoing commercial success in this cutthroat digital age.
To keep your mind fresh, here is a summary of the attributes that you should look for in a data discovery software:
- They zero in on business users, offering an environment that is free of code.
- They enable businesses to obtain a variety of data sources.
- They supply data preparation and modeling capabilities, like combining data from disparate sources.
- They provide easy-to-understand depictions of data via online data visualizations.
- They can enable visualizations that are interactive for the user.
- They support statistical analysis through guided advanced analytics attributes that are ready immediately upon implementation.
- They provide various choices to facilitate insight sharing among peers.
- They allow you to generate accurate predictions based on your historical performance
- Analysis, analytics, and data preparation are streamlined and integrated.
At datapine, we offer these and more powerful features for the discovery process. Regardless of your department, industry, or current level of digital maturity, our dashboards, tools, and templates will help drive your business towards a bright and prosperous future.
To see examples of what we have to offer and how we can improve your data discovery process, explore our range of dashboard examples or sign up for a 14-day trial completely free!
And remember, data is power – use it wisely, and you’ll have the world at your fingertips.