
This article is going to describe the concepts of data analytics to answer the question – What is Data Analytics? You can read more articles by clicking on the Data Science/Analytics.
What is Data Analytics?
When we access different websites, shop online, send Whatsapp messages and emails, access social media, attend meetings and so much more from our laptops and mobiles, we are generating data in exabytes ( bytes)! As one part of the globe sleeps, the other part starts their day and it so truly proves that data never sleeps. With tremendous data being generated every second, it is not difficult to imagine the potential of the many vital insights that may be hiding in the data like gems hidden in a mine. But just collecting enormous amounts of raw data won’t help. We need some techniques to analyze and build models to interpret trends, study historical patterns as well as make predictions using this data.
Data analytics can be aptly defined as the science of collecting and cleaning data and then using technology, statistics and business to find insights or patterns from that data.
The data analytics process can be broken down into six steps as given below (Find more details here):
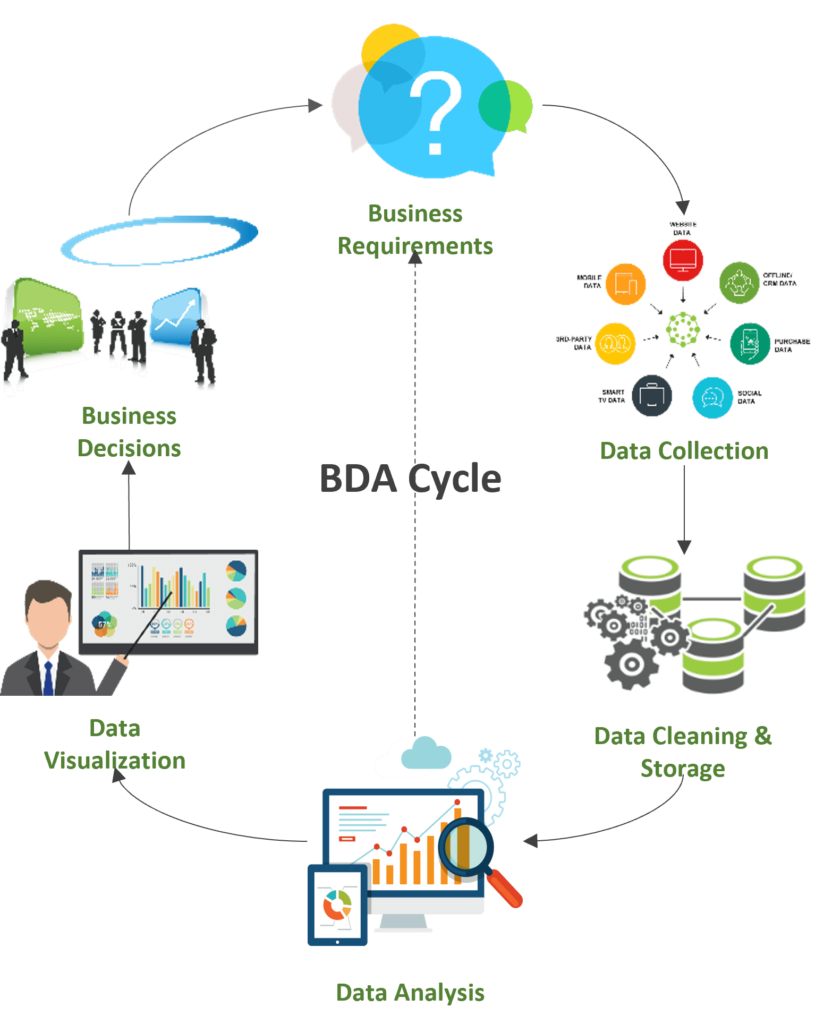
- Business requirements: Business first decides on what needs to be analyzed and what is expected out of the analysis. Let us say that a retail company wants to choose a region to launch their new product. They would want to analyze the customer segment, their orders for related products and the region.
- Data collection: Looking at the requirements, the sources of data collection and the frequency of collecting data can be decided. The company can collect data related to orders, customers and sales.
- Data cleaning and storage: The collected data may not be directly useful and can lead to incorrect analysis. Hence, it needs to be cleaned, made free of erroneous records and then stored. Cleaning involves handling null values, outliers, duplicate values, synchronizing data to correct formats and much more. Data can be stored in a data warehouse or any other system suitable to the business.
- Data analysis: Once the data is clean, data analysis models can help find trends or predict values using machine learning models. Here we can also decide if more data needs to be collected. In the retail company example, a machine learning model can be used to predict sales if they launch their product in different regions.
- Data visualization: After the analysis, the data patterns can be displayed graphically to see how the sales would vary if the number of customers or region or other factors change.
- Business decisions: Using the inferred insights from analysis and visualization, business can take decisions. The retail company can choose the region they want to launch their product in.
Let us look at some more examples of how data analytics can help business as well as society.
Uses and examples of Data Analytics
Using data analytics we can examine data as well as build models using historical data and make predictions which can help business in the following ways:
Decision making: Data analytics techniques can provide vital insights about the pros and cons of business decisions. Continuing with the above example, the company can use data analytics to predict consumer behavior, look at the sales and current market to price their product. They can analyze the market to look at consumer buying trends to decide on an opportune time to launch the product. This will not only ensure great sales and profit but also help them develop their business in the future.

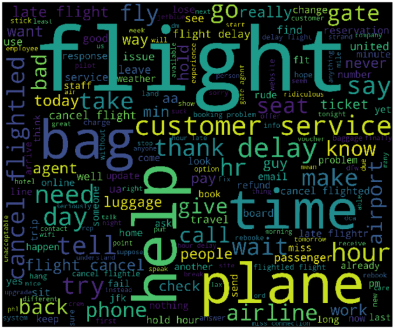
Improve customer service: Consumers write reviews about their airline travel experience, food, travel company experience, and so much more. These reviews contain vital information which can be used to satisfy consumers and in turn help businesses grow! Check out the word clouds created from tweet feedback.
Relevant marketing: Studying the consumer activities and their shopping histories by using data trends, companies can target consumers and decide appropriate timing and coupon strategies to grow business. Marketing based on the shopping history of consumers based on age, gender and survey feedback can also be helpful.
Increasing profits: When you know your consumers, you can create appropriate advertisements, target correct consumers, launch sale/coupons and new products at the correct time and in general prepare a solid sales strategy and use funds appropriately.
Social good: Data analytics is not only used to increase revenues and plan business better, but it is being used in many projects for the welfare of the society. It is being used to map homeless people to the nearest shelter homes, predict long term unemployment and provide help, improve traffic safety through video analysis, predict students that will struggle academically by third grade, develop early warning system for water infrastructure problems, find the causes of death and so many more.
To summarize, I would say that data analytics is not only helping business serve their consumers better, make informed decisions, and ensure good financial growth but also to help people live a happy and healthy life!
You can learn more about Business Analysis and Analytics at our Blog.

About Techcanvass
Techcanvass offers Business Analysis and Analytics certification courses for professionals. We are an IIBA endorsed education provider (EEP) and iSQI Germany Authorized Training Partner.
Know more about our Tableau Certification program, PowerBI certification program, Data Analytics Certification with Excel programs.
We also offer IIBA Certification courses and Domain Certification Courses in Banking, Payments, Trade Finance, Insurance and US Healthcare.
