

Many of you must have heard about Tableau and its popularity in the market. Many of you must have an idea about Tableau being used for data visualization and to infer insights. But Tableau is much more than that.
TABLEAU revolutionized Business Intelligence and paved the way for intuitive Visual Data Analytics for everyone, regardless of their technical knowledge. Wow! That sounds great. But what is Business Intelligence and Analytics? What is different in visual analytics? Why is it needed? How does it impact business? Let us explore all these questions in detail.
Business Intelligence
Business intelligence is the process of collecting, storing, and analyzing business data. It supports data-driven decision-making by analyzing massive data for meaningful information. Using statistics, analytics and modeling, strategic business opportunities can be identified and created. And this results in business success with better intelligence, in almost every aspect.
It helps drive:
- Innovation in Business
- Identify Growth Opportunities
- Strategize and Market New Products
- Market Insights & Benchmarking
- Improve Risk Management
And it is impactful because:
- Internal and external data together provide intelligence for unparalleled growth.
- It changes intuition-based decision-making in order to make data-driven decision-making, which leads to better outcomes and improvements.
Let us look at some examples.
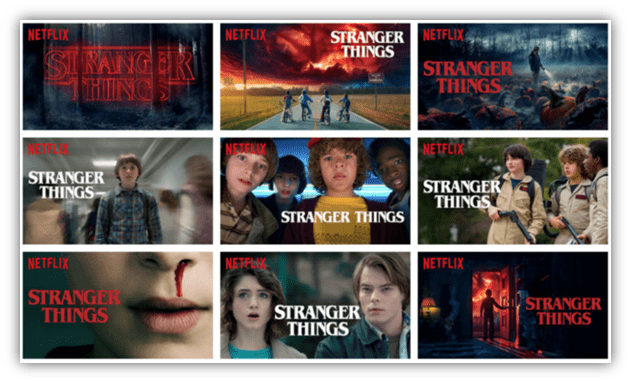
Netflix: Personalized Accounts for Each Customer
Source: https://netflixtechblog.com/artwork-personalization-c589f074ad76
Netflix is the world’s leading streaming entertainment service with 204 million paid memberships in over 190 countries, enjoying TV series, documentaries, and feature films across a wide variety of genres and languages.
- Netflix creates a fully personalized homepage for each customer using data for the movies/TV shows relevant in order to have each customer’s preference, current mood, and context.
- Personalization is across many dimensions – the suggested videos and their ranking, also the arrangement of videos on the canvas, and the artwork displayed for the movie/show. It is impressive how data has fostered the development of so many creative ideas.
Tesla: Customer Satisfaction and Driverless Cars
- Tesla uses data for customer satisfaction by analyzing the online customer forum in order to make improvements in the next production.
- They are paving the way for driverless cars using accurate road maps, traffic data, weather conditions with the help of data.
- Data helps them find the root causes of issues hampering production, saving valuable time.
Intuitive Visual Analytics
Data Analytics is the science of examining not just business but any raw data and information to draw insights using statistics, AI, machine learning, and so on. And visualization is also representing data in an easily interpretable format.
Visual analytics combines data analytics and data visualization. It makes the data discovery process richer by allowing you in order to discover insights at each step. Earlier, data analysis and visualization were separate steps. Analysts used to write queries, and then the output would be displayed as a chart. This restricted the process.
In visual analytics, we also combine powerful analytics with visual interactivity, allowing users to observe the feedback immediately and change the analysis direction if needed. You can strategize as you think! It is different from data visualization, which is most of the time static. Visual analytics also allows dynamic and interactive exploration, thus improving joint decision-making.
It helps drive:
- Find the root cause of problems – Why something happened, share key findings and collaborate.
- Make data-driven decisions using insights created.
- Make data accessible to everyone.
- Create a data-driven culture in the organization.
And it is impactful because:
- Many times unexpected findings from data can direct your thought and method of exploration.
- It supports open-ended data exploration and empowers you in order to follow your thoughts visually based on the data patterns you see.
- It helps you focus on exploring instead of writing code for a particular chart.
Uses of Visual Analytics in a Nutshell
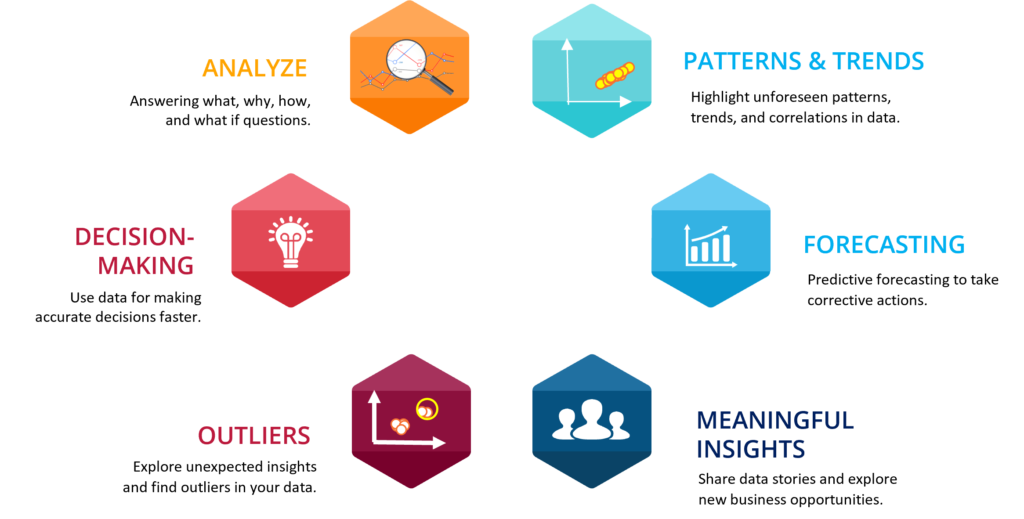
Tableau in Action!
Simple Analysis
for instance, This sales dashboard shows the current sales for sub-categories and across states. It also forecasts sales for the next year.
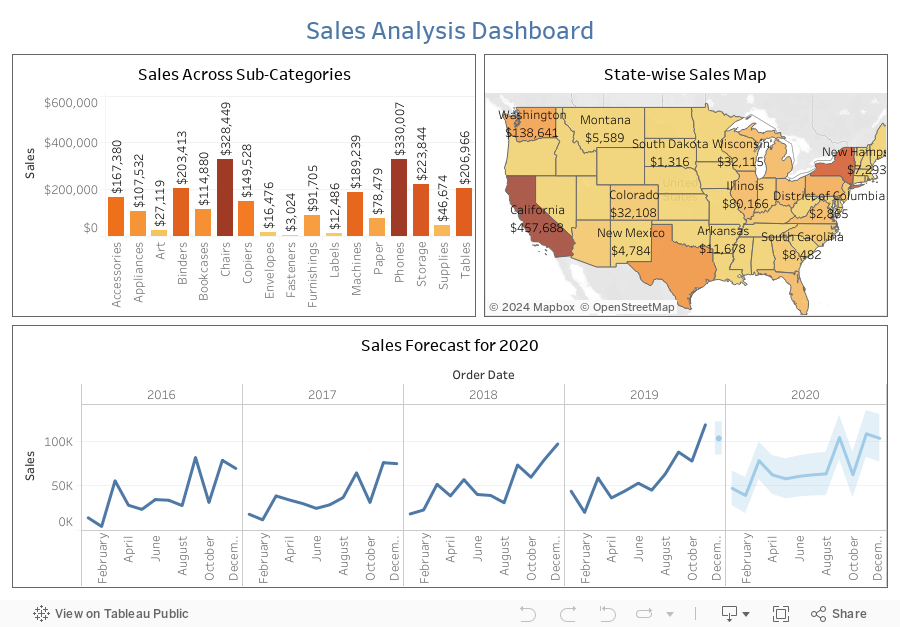
Tableau also connects with data from a wide range of sources. Quick analysis in minutes can save a lot of valuable time. And reduces burden on specialized IT team as anyone can access it.
Finding the Root Cause
In this dashboard, low profit is seen for Tables. As we dig in, we see that high discounts are contributing to low profits and action needs to be taken accordingly.
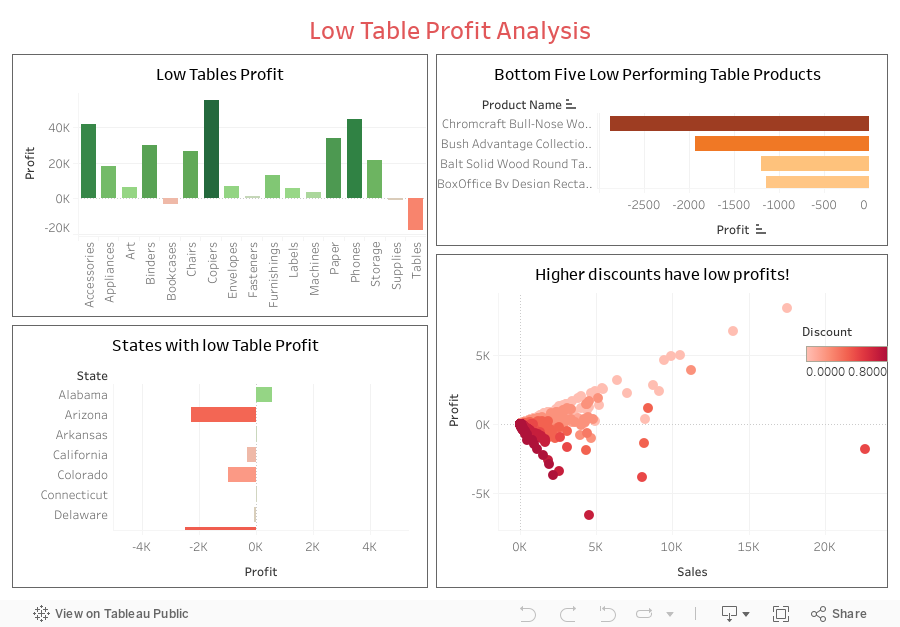
Tableau is useful for advanced analytics and predictive modeling. You can share your analysis securely. And lastly, it is exciting and fun to work with Tableau!!
About Techcanvass
Techcanvass offers Business Analysis and Analytics certification courses for professionals. We are an IIBA endorsed education provider (EEP) and iSQI Germany Authorized Training Partner.
Know more about our Tableau Certification program, PowerBI certification program, Data Analytics Certification with Excel programs.
We also offer IIBA Certification courses and Domain Certification Courses in Banking, Payments, Trade Finance, Insurance and US Healthcare.
