article thumbnail

Comparing Data Visualizations: Bar vs. Stacked, Icons vs. Shapes, and Line vs. Area

Insight Software

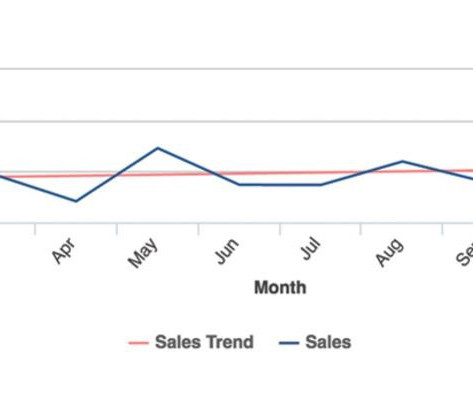
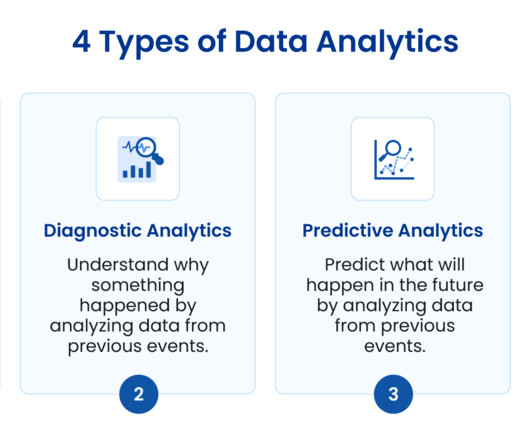
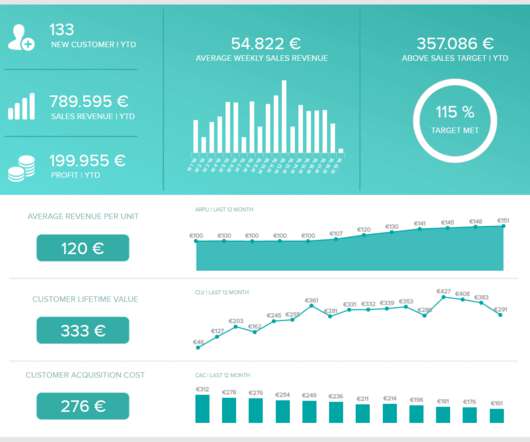
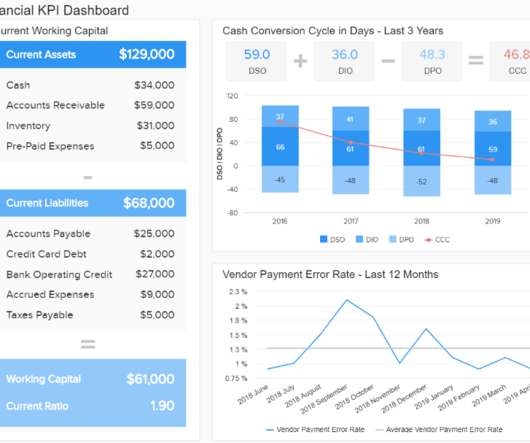
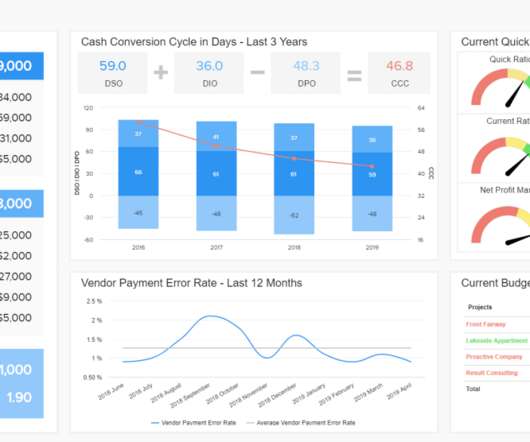
Great data visualizations have the power to persuade decision makers to take immediate, appropriate action. When done well, data visualizations help users intuitively grasp data at a glance and provide more meaningful views of information in context. Modern data visualization platforms offer countless options.

article thumbnail

Seven Data Management Tips and Best Practices for Small Business Owners

Dataversity

Regardless of one’s industry or field, every organization always uses data in their everyday operations to help them attain their goals or help monitor their performance. However, without incorporating Data Management best practices, your data analysis may be flawed. […].

Insiders

Sign Up for our Newsletter

This site is protected by reCAPTCHA and the Google Privacy Policy and Terms of Service apply.

article thumbnail

Essential Technical Skills for Business Analysts in 2024

The BAWorld

Data Visualization: Master presenting complex data in easy-to-understand formats like charts and graphs using tools like Tableau or Power BI. SQL: Gain proficiency in SQL , a language for managing and manipulating relational databases. Analyze cloud requirements, cost implications, and impact on existing systems.

article thumbnail

In-Demand Business Analytics Skills to Get You Hired in 2024

The BAWorld

Business Analytics Professional Data has always been central when it comes to business analytics professionals, Business analytics professionals focus on analyzing data to derive insights and support data-driven decision-making. You can employ the concepts of probability and statistics to: Detect patterns in data.

article thumbnail

Data Storytelling: The Ultimate Collection of Resources

Juice Analytics

From Edward Tufte's Visual Explanations, a diagram based on Salman Rushdie‘s description of the Indian epid Kathasaritsagara or Ocean of the Streams of Story. The hot new concept in data visualization is "data storytelling"; some are calling it the next evolution of visualization (I'm one of them).

article thumbnail

You Can Have Traditional BI and Augmented Analytics!

ElegantJ BI

The benefits of this type of solution include: Personalized Dashboard Multidimensional Key Performance Indicators (KPIs) Deep-Dive Analytics Social BI tools for data sharing Graphical Analysis and Cross-Tab Analytics for Intuitive reporting What-If Analysis to test pricing, budget and cost information GeoMap support with interactive maps Out-of-the-Box (..)