article thumbnail

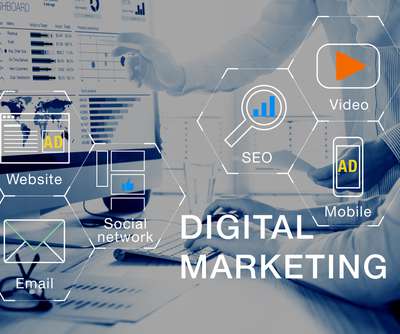
Big Data Is Shaping These Huge Digital Marketing Trends In 2020

Smart Data Collective

Big data is playing a huge role in the digital marketing profession in 2020. Digital marketing trends (like omnichannel marketing, AI, VSEO) that were once seemed outlandish to the average business owner are now essential to their success in 2020. You cannot avoid personalization in 2020 if you want to entice your customers.

Big Data 290
article thumbnail

Visualizing Women's Impact to History Through Data Visualization

Tableau

In the age of data-driven insights, it's fitting to explore how data visualization can be a powerful tool in telling the stories of women's achievements, struggles, and progress. You could also visualize social issues that impact women such as the gender pay gap, healthcare, or female representation in politics."

Insiders

Sign Up for our Newsletter

This site is protected by reCAPTCHA and the Google Privacy Policy and Terms of Service apply.

article thumbnail

The Future of Cloud-Based Team Collaboration Software in 2020

Smart Data Collective

Why Does Collaboration Software Matter in 2020? 2020 was the year that saw a shift in remote work like never before. Video conferencing is likely to become even more integrated with workflows, allowing you to go through visual elements that enhance the meetings and boost productivity. Enhancing Remote Work.

article thumbnail

2020 #VizInReview: The year in Viz of the Days

Tableau

December 23, 2020 - 9:01pm. December 24, 2020. Let’s be real, 2020 has been one incredibly wild ride that no one expected. To mark the end of 2020, we’re taking a look back at some of the most amazing visualizations created by the #DataFam this year. . Kristin Adderson. See a viz that you love?

article thumbnail

Visualizing the DC Police budget

Tableau

In 2020, the DC Fiscal Policy Institute (DCFPI) partnered with the Urban Institute’s Justice Policy Center (Urban) to create an online tool to demystify the local police budget in DC, one of the most heavily-policed jurisdictions in America. The visualization also provides a deep dive into how police in schools are funded in Washington, DC.

article thumbnail

Inform Your 2021 By Looking At the Most Popular Finance Content of 2020

Insight Software

With 2020 being such an unusual and unexpected year, we’re looking back on our top content from the past 12 months. The lessons we have all learned from the changes 2020 brought can give you an advantage in 2021. These enable them to have a visual view of what’s going on, for quicker understanding. Tiny Charts. Filter Hacks.

Finance 105