

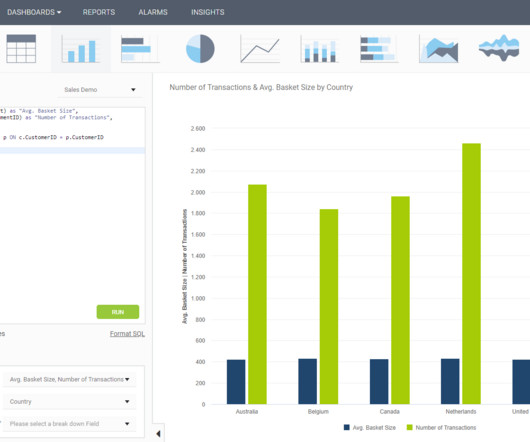
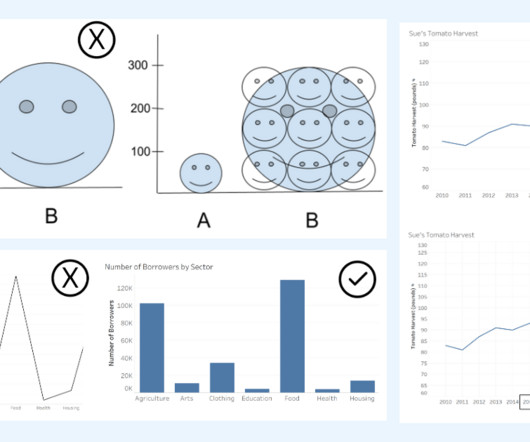
Why do Business Analysts need to learn Data visualization skills?
The BAWorld
SEPTEMBER 29, 2020
But why Data visualization? In this article, I am going to examine Why do Business Analysts need to learn Data visualization skills? This report suggests that, in 2020, the job requirements for data science and analytics is projected to boom to by 364,000 openings to 2,720,000. They need to learn various skills.


Let's personalize your content